Activity 1: Assessing Starch Digestion by Salivary Amylase (pp. 121
advertisement

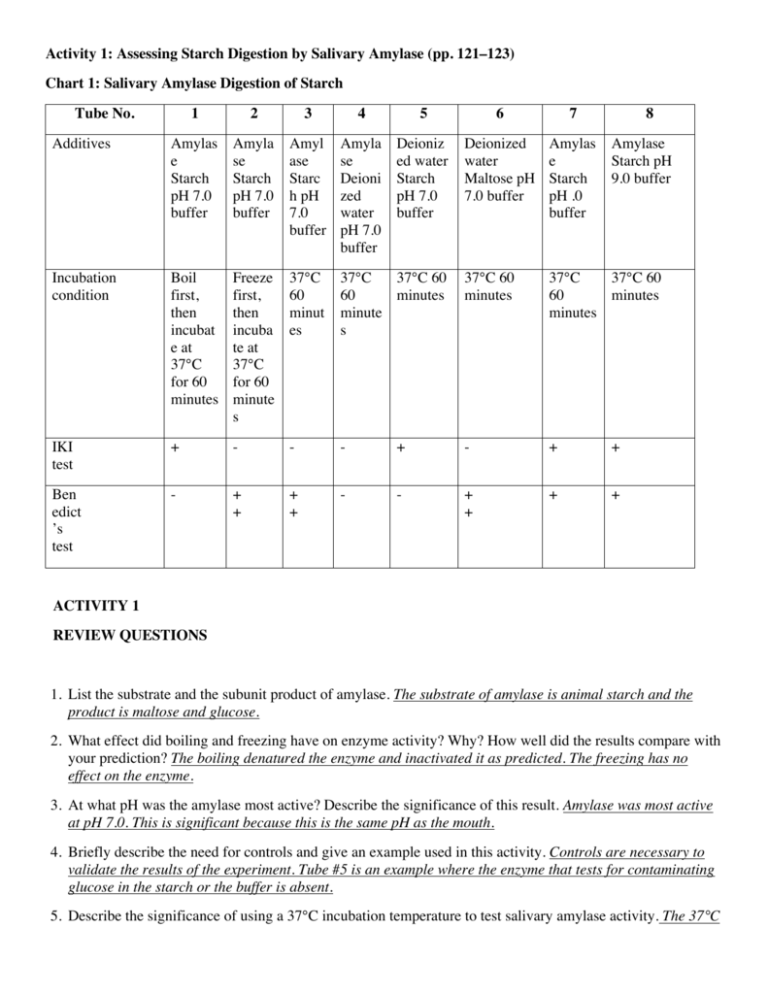
Activity 1: Assessing Starch Digestion by Salivary Amylase (pp. 121–123) Chart 1: Salivary Amylase Digestion of Starch Tube No. 1 2 3 4 5 6 7 8 Additives Amylas e Starch pH 7.0 buffer Amyla se Starch pH 7.0 buffer Amyl ase Starc h pH 7.0 buffer Amyla se Deioni zed water pH 7.0 buffer Deioniz ed water Starch pH 7.0 buffer Deionized water Maltose pH 7.0 buffer Amylas e Starch pH .0 buffer Incubation condition Boil first, then incubat e at 37°C for 60 minutes Freeze first, then incuba te at 37°C for 60 minute s 37°C 60 minut es 37°C 37°C 60 60 minutes minute s 37°C 60 minutes 37°C 37°C 60 60 minutes minutes IKI test + - - - + - + + Ben edict ’s test - + + + + - - + + + + Amylase Starch pH 9.0 buffer ACTIVITY 1 REVIEW QUESTIONS 1. List the substrate and the subunit product of amylase. The substrate of amylase is animal starch and the product is maltose and glucose. 2. What effect did boiling and freezing have on enzyme activity? Why? How well did the results compare with your prediction? The boiling denatured the enzyme and inactivated it as predicted. The freezing has no effect on the enzyme. 3. At what pH was the amylase most active? Describe the significance of this result. Amylase was most active at pH 7.0. This is significant because this is the same pH as the mouth. 4. Briefly describe the need for controls and give an example used in this activity. Controls are necessary to validate the results of the experiment. Tube #5 is an example where the enzyme that tests for contaminating glucose in the starch or the buffer is absent. 5. Describe the significance of using a 37°C incubation temperature to test salivary amylase activity. The 37°C incubation is significant because it is the same temperature as body temperature so it should be ideal for the enzyme. Activity 2: Exploring Amylase Substrate Specificity (pp. 123–125) Chart 2: Enzyme Digestion of Starch and Cellulose Tube No. 1 2 Additives Amylase Starch pH 7.0 buffer Amylas e Glucos e pH 7.0 buffer Incubation condition 37°C 60 minutes IKI test Bene dict’s test 3 Amylase Cellulose pH 7.0 buffer 4 5 6 Deioniz Peptidase Starch pH ed 7.0 buffer water Cellulo se pH 7.0 buffer Bacteria Cellulose pH 7.0 buffer 37°C 37°C 60 60 minutes minutes 37°C 37°C 60 minutes 60 minutes 37°C 60 minutes - - + + + - + + + + - - - + + ACTIVITY 2 REVIEW QUESTIONS 1. Describe why the results in tube 1 and tube 2 are the same. In tube #1 the amylase is hydrolyzing the starch to glucose and in tube #2 the glucose is already present in the hydrolyzed form. 2. Describe the result in tube 3. How well did the results compare with your prediction? The correct prediction is “no”. Tube #3 should not be positive for the Benedict’s test because amylase should not digest cellulose. 3. Describe the usual substrate for peptidase. The usual substrate for peptidase is peptides and proteins. 4. Explain how bacteria can aid in digestion. Bacteria can aid in digestion by breaking down cellulose which we do not produce cellulase. Activity 3: Assessing Pepsin Digestion of Protein (pp. 125–126) Chart 3: Pepsin Digestion of Protein Tube No. Additives 1 Pepsin BAPNA pH 2.0 buffer 2 4 5 6 Pepsin Deionized water pH 2.0 buffer Deionized water BAPNA pH 2.0 buffer Pepsin BAPNA pH 7.0 buffer Pepsin BAPNA pH 9.0 buffer Incubation Boil first, 37°C 60 condition then minutes incubate at 37°C for 60 minutes 37°C 60 minutes 37°C 60 minutes 37°C 60 minutes 37°C 60 minutes Optical density 0.00 0.00 0.03 0.00 0.00 Pepsin BAPNA pH 2.0 buffer 3 0.40 ACTIVITY 3 REVIEW QUESTIONS 1. Describe the effect that boiling had on pepsin and how you could tell that it had that effect. Boiling inactivated the pepsin. This is evidenced by the fact that no activity was seen with Tube #1. However, the enzyme was very active in Tube #2. 2. Was your prediction correct about the optimal pH for pepsin activity? Discuss the physiological correlation behind your results. The correct prediction is pH 2.0. This is because pepsin is most active at the pH of gastric juice which is about pH 2.0. 3. What do you think would happen if you reduced the incubation time to 30 minutes for tube 5? If the incubation time were reduced, it is possible that no digestion of protein would be seen since only a small amount is seen. Activity 4: Assessing Lipase Digestion of Fat (pp. 127–128) Chart 4: Pancreatic Lipase Digestion of Triglycerides and the Action of Bile Tube No. 1 Additives Lipase Vegetable oil Bile salts pH 7.0 buffer 3 4 Lipase Vegetable oil Deionized water pH 7.0 buffer Lipase Deionized water Bile salts pH 9.0 buffer Deionized water Vegetable oil Bile salts pH 7.0 buffer Lipase Vegetable oil Bile salts pH 2.0 buffer Lipase Vegetable oil Bile salts pH 9.0 buffer Incubation 37°C 60 condition minutes 37°C 60 minutes 37°C 60 minutes 37°C 60 minutes 37°C 60 minutes 37°C 60 minutes pH 6.72 9.00 7.00 2.00 8.97 6.21 2 5 6 ACTIVITY 4 REVIEW QUESTIONS 1. Explain why you can’t fully test the lipase activity in tube 5. Measurement of lipase activity uses a decrease in pH. Since the pH in Tube #5 is already very low, it is difficult to tell if fatty acids are released. 2. Which tube had the highest lipase activity? How well did the results compare with your prediction? Discuss possible reasons why it may or may not have matched. The correct prediction is Tube #1, pH 7.0, which approximates the pH of the small intestine. 3. Explain why pancreatic lipase would be active in both the mouth and the intestine. Since the activity of pancreatic lipase is highest at pH 7.0, the enzyme should be active in the mouth and the pancreas. 4. Describe the process of bile emulsification of lipids and how it improves lipase activity. Bile serves to mechanically break up large globules of fat and produce small droplets that effectly increases the surface area of the lipids.


