Population Growth Rate Problems
advertisement
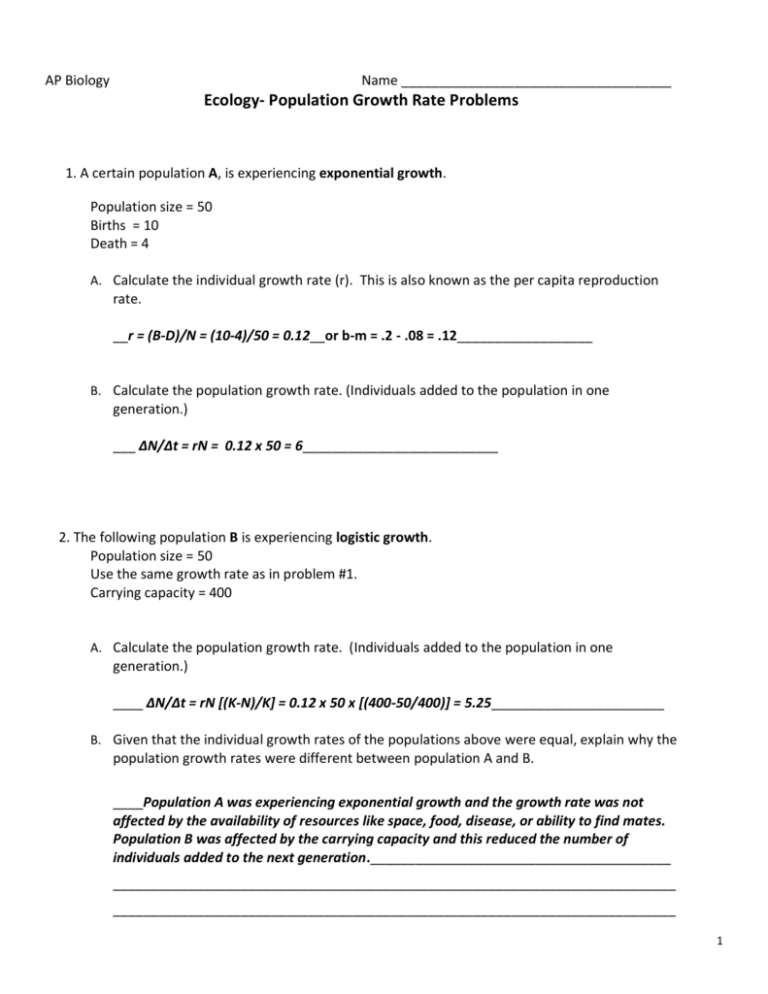
AP Biology Name ____________________________________ Ecology- Population Growth Rate Problems 1. A certain population A, is experiencing exponential growth. Population size = 50 Births = 10 Death = 4 A. Calculate the individual growth rate (r). This is also known as the per capita reproduction rate. __r = (B-D)/N = (10-4)/50 = 0.12__or b-m = .2 - .08 = .12__________________ B. Calculate the population growth rate. (Individuals added to the population in one generation.) ___ ΔN/Δt = rN = 0.12 x 50 = 6__________________________ 2. The following population B is experiencing logistic growth. Population size = 50 Use the same growth rate as in problem #1. Carrying capacity = 400 A. Calculate the population growth rate. (Individuals added to the population in one generation.) ____ ΔN/Δt = rN [(K-N)/K] = 0.12 x 50 x [(400-50/400)] = 5.25_______________________ B. Given that the individual growth rates of the populations above were equal, explain why the population growth rates were different between population A and B. ____Population A was experiencing exponential growth and the growth rate was not affected by the availability of resources like space, food, disease, or ability to find mates. Population B was affected by the carrying capacity and this reduced the number of individuals added to the next generation.________________________________________ ___________________________________________________________________________ ___________________________________________________________________________ 1 3. The following population, C, has no limits on food resources or space: Population size = 500 Births = 240 Deaths = 170 A. Calculate the r for this population if it is experiencing exponential growth. ___.14______________________ B. How many individuals will be in the population at the start of the second generation? ____.14 x 500 = 70 + 500 = 570____________________ C. How many individuals will be in the population at the start of the third generation? ____.14 x 570 = 79.8 or 80 + 570 = 650_____________________ 4. Now consider population D, in which food resources are limited and it is experiencing a logistic growth pattern. Population size = 500 rmax= the same for the previous problem Carrying Capacity = 1,000 A. How many individuals would be in the population at the start of the second generation. __ ΔN/Δt=r max N[(K-N0/K)____.14 x 500 x [(1000-500)/1000] = 35 + 500 = 535_____________ B. How many individuals would be in the population at the start of the third generation. __570________________________ 2 5. Fill in the following chart to calculate the population growth rates for a population of rats (Rattus norwegicus ), in an urban area. The starting population is 450 individuals and the rmax is equal to .15. The population is experiencing logistic growth and the carrying capacity of the environment is 1000 rats. Generation 1 N rmax 450 .15 ΔN/Δt=rmax N (K-N)/K final ΔN/Δt 2 3 4 5 6 A. In which of the generations (1-6) does the birth rate exceed the death rate? ___________ B. Does this population reach zero growth rate at any point in generations 1-6? (Y, N)______ C. Explain why the growth rate for the logistic model (final ΔN/Δt) increase from generation 1-2. ________________________________________________________________________ ________________________________________________________________________ D. Explain why the growth rate begins to decrease after generation 2. ________________________________________________________________________ ________________________________________________________________________ E. Considering the above population, explain how the increase in numbers of individuals affects the growth rate of the population over time. ________________________________________________________________________ ________________________________________________________________________ 3 More Population Ecology Practice Problems-Some of the following questions have been answered in Bolded Italics. Use the methods shown to answer the additional problems. Show your work in the space provided. The following equations may help you. This list will be available to you during the AP Biology Exam but they may use different symbols or names to denote variables. For example, they use “Population Growth to represent Individual growth rate. The calculations are still the same. The symbols below refer to the variables used in your notes packet. Birth rate b = B/N t=time Death rate m = D/N B=births during time b=birth rate Individual or Population Growth Rate (per capita) D=deaths during time m=death rate r=(B-D)/N or r = b-m N=population size Exponential Growth Rate Calculation ΔN/Δt=rmaxN ΔN/Δt =change in population #’s over time* Logistic Growth Rate Calculation K=carrying capacity ΔN/Δt=r max N[(K-N)/K] rmax=maximum per capita growth rate of population *Note: Sometimes the small letter d is used instead of Δ. d also represents change over a small period of time. Population Density Problems: 6. If 300 blue jays are found in a 20 hectare plot, what is the density in blue jays/hectare in that plot? Round to the nearest whole number. 300/20= 15 blue jays/hectare 7. If 3400 maple trees are counted on a 3km x 4km rectangular patch of land, what is the density of maple trees per square kilometer? Round your answer to the nearest tenth. 8. Suppose the population density of a sample of deer is 50 per square kilometer. Assuming that the population is uniformly distributed what would the population size be if the deer encompassed an area that was 20km x 200km? Round your answer to the nearest whole number. Population Growth Problems: 9. There are 252 deer in a population. There is no net immigration or emigration. If 47 deer die and 32 deer are born in one month, what is the population size at the end of the month? Round your answer to the nearest whole number. 10. In a population of 600 squirrels, the per capita birth rate in a particular period is 0.06 and the per capita death rate is 0.12. a. What is the per capita growth rate of the population? Round your answer to the nearest hundredth. R = 0.06-0.12 = -0.06 b. What is the actual number of squirrels that die during this particular period? Round your answer to the nearest whole number. D = 600x0.12 = 72 deaths c. What is the actual number of squirrels that are born during this period? Round your answer to the nearest whole number. B = 600x0.06 = 36 Births 4 11. In a population of 750 fish, 25 die on a particular day while 12 were born. a. What is the per capita death rate for the day? Round your answer to the nearest thousandth. b. What is the per capita birth rate for the day? Round your answer to the nearest thousandth. c. What is the per capita rate of increase for the day? Round your answer to the nearest thousandth. 12. There are 2,000 mice living in a field. If 1,000 mice are born each month and 200 mice die each month, what is the per capita growth rate of mice over a month? Round to the nearest tenth. Note: You can use r = b – m or r = (B-D)/N Survivorship and Mortality Rates: 13. Suppose that of a cohort of 200 rats in a rat colony born in January, 160 are still alive at the start of March and 120 are still alive at the start of May. a. What is the survivorship up to the start of March? Round to the nearest hundredth. 160/200 = 0.80 b. What is the mortality rate from the beginning of March to the beginning of May? Round to the nearest hundredth. 40/160 = 0.25 c. If the survivorship during May is 0.3, how many rats died during the month of May? Round to the nearest whole number. 120 x 0.3 = 36 survived, 120-36 = 84 died 14. Suppose that of a cohort of 150 mice in a mouse colony born in February, 125 are still alive at the end of March and 115 are still alive at the end of April. a. What is the survivorship up to the start of April? Round to the nearest hundredth. b. What is the mortality rate during the month of March? Round to the nearest hundredth. c. If the survivorship during May is 0.5, how many mice will there be at the end of May? Round to the nearest whole number. 15. The doubling time of a population of plants is 12 years. Assuming that the initial population is 300 and that the rate of increase remains constant, how large will the population be in 36 years? 16. Suppose that 50 fish are born in year 1. There are only 36 left in year 2 and 22 left in year 3. What is the mortality rate between years 2 and 3? Round to the nearest hundredth. 5 Population Studies 17. You and your friends have monitored two populations of wild lupine for one entire reproductive cycle (June year 1 to June year 2). By carefully mapping, tagging, and taking a census of the plants throughout this period, you obtain the data listed in the chart. Parameter Initial # of plants Number of new seedlings established Number of initial plants that die Population A 500 100 20 Population B 300 30 100 a. Calculate the following parameters for each population. Round each to whole number or hundredth where applicable. Parameter Population A B (births during time interval) 100 D (deaths during time interval) 20 b (per capita birth rate) 100/500=0.20 d (per capita death rate) 20/500=0.04 r (per capita rate of increase) Population B 0.2-0.04=0.16 or (100-20)/500 b. Given the initial population size of Population A and assuming that the population is experiencing growth at the growth rate r (calculated above), what will the number of plants be in each of the next 5 years? (Use the initial population size as time 0.) Round each to the nearest whole number. Time (year) Population Size 0 500 1 (.16)(500)+500 = 580 2 3 4 5 (Adapted from: Mastering Biology, Pearson 2013) 18. A population of 265 swans was introduced to Circle Lake. The population’s birth rate is 0.341 swans/year per capita, and the death rate is 0.296 swans/year per capita. What is the rate of population growth per capita, and is it increasing or decreasing? Round to the nearest thousandth. 6 19. Challenge Question (you will not be asked to answer a question like this on your test). A population of 1492 Baltimore orioles was introduced to an area of Nerstrand Woods. Over the next year, the Orioles show a death rate of 0.395 while the population drops to 1134. What’s the birth rate for this population? Round to the nearest hundredth. Hint: ΔN/Δt= change in the population over 1 year ΔN/Δt =(b-m)N , you will solve for b 20. One dandelion plant can produce many seeds leading to a high growth rate for dandelion populations. If a population of dandelions is currently 40 individuals and rmax = 0.2 dandelions/month per capita, predict how many dandelions would be in this population after 4 months. Round to the nearest whole number. Month 1 (0.2)(40)=8 Individuals added Month 2 (0.2)(40+8)= 9.6 Month 3 Month 4 21. Imagine the dandelion population of 40 (in #20) cannot continue to grow exponentially due to lack of space. The carrying capacity for their patch of lawn is 70 dandelions. What is their dN/dt in this logistic growth situation? Round to the nearest tenth. 22. A hypothetical population has a carrying capacity of 1,500 individuals and rmax is 1.0. Fill out the following table. Round all answers to the nearest whole number. Population Size Show Work Here Population Growth 1600 1750 2000 7
