Understanding Web Images by Object Relation Network
advertisement
Understanding Web Images by Object Relation Network
Na Chen
Qian-Yi Zhou
Viktor K. Prasanna
Dept. of Computer Science
University of Southern
California
Los Angeles, CA, USA
Dept. of Computer Science
University of Southern
California
Los Angeles, CA, USA
nchen@usc.edu
qianyizh@usc.edu
Ming Hsieh Dept. of Electrical
Engineering
University of Southern
California
Los Angeles, CA, USA
BasketballPlayer1
Person 1
throw
Basketball1
hold
SoccerBall1
prasanna@usc.edu
A Collection of
SoccerPlayers
SoccerPlayer2
SoccerPlayer1
SoccerPlayer3
kick
kick
SoccerBall1
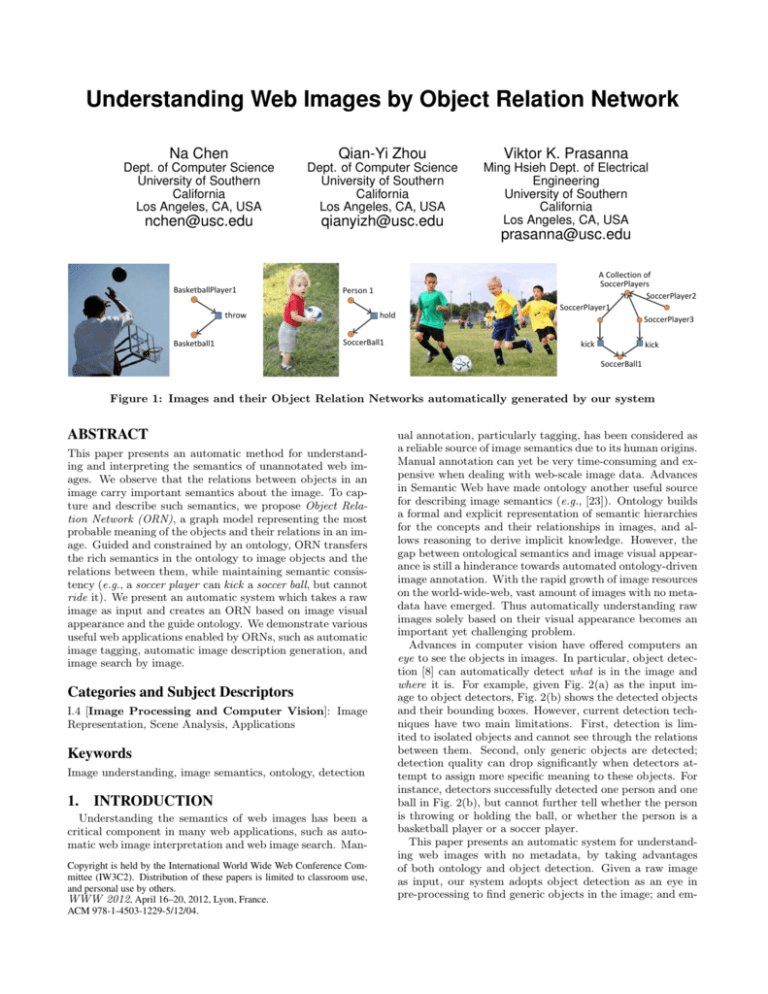
Figure 1: Images and their Object Relation Networks automatically generated by our system
ABSTRACT
This paper presents an automatic method for understanding and interpreting the semantics of unannotated web images. We observe that the relations between objects in an
image carry important semantics about the image. To capture and describe such semantics, we propose Object Relation Network (ORN), a graph model representing the most
probable meaning of the objects and their relations in an image. Guided and constrained by an ontology, ORN transfers
the rich semantics in the ontology to image objects and the
relations between them, while maintaining semantic consistency (e.g., a soccer player can kick a soccer ball, but cannot
ride it). We present an automatic system which takes a raw
image as input and creates an ORN based on image visual
appearance and the guide ontology. We demonstrate various
useful web applications enabled by ORNs, such as automatic
image tagging, automatic image description generation, and
image search by image.
Categories and Subject Descriptors
I.4 [Image Processing and Computer Vision]: Image
Representation, Scene Analysis, Applications
Keywords
Image understanding, image semantics, ontology, detection
1. INTRODUCTION
Understanding the semantics of web images has been a
critical component in many web applications, such as automatic web image interpretation and web image search. ManCopyright is held by the International World Wide Web Conference Committee (IW3C2). Distribution of these papers is limited to classroom use,
and personal use by others.
WWW 2012, April 16–20, 2012, Lyon, France.
ACM 978-1-4503-1229-5/12/04.
ual annotation, particularly tagging, has been considered as
a reliable source of image semantics due to its human origins.
Manual annotation can yet be very time-consuming and expensive when dealing with web-scale image data. Advances
in Semantic Web have made ontology another useful source
for describing image semantics (e.g., [23]). Ontology builds
a formal and explicit representation of semantic hierarchies
for the concepts and their relationships in images, and allows reasoning to derive implicit knowledge. However, the
gap between ontological semantics and image visual appearance is still a hinderance towards automated ontology-driven
image annotation. With the rapid growth of image resources
on the world-wide-web, vast amount of images with no metadata have emerged. Thus automatically understanding raw
images solely based on their visual appearance becomes an
important yet challenging problem.
Advances in computer vision have offered computers an
eye to see the objects in images. In particular, object detection [8] can automatically detect what is in the image and
where it is. For example, given Fig. 2(a) as the input image to object detectors, Fig. 2(b) shows the detected objects
and their bounding boxes. However, current detection techniques have two main limitations. First, detection is limited to isolated objects and cannot see through the relations
between them. Second, only generic objects are detected;
detection quality can drop significantly when detectors attempt to assign more specific meaning to these objects. For
instance, detectors successfully detected one person and one
ball in Fig. 2(b), but cannot further tell whether the person
is throwing or holding the ball, or whether the person is a
basketball player or a soccer player.
This paper presents an automatic system for understanding web images with no metadata, by taking advantages
of both ontology and object detection. Given a raw image
as input, our system adopts object detection as an eye in
pre-processing to find generic objects in the image; and em-
ploys a guide ontology as a semantic source of background
knowledge. We propose Object Relation Network (ORN) to
transfer rich semantics in the guide ontology to the detected
objects and their relations. In particular, ORN is defined as
a graph model representing the most probable ontological
class assignments for the objects and their relations. Our
method automatically generates ORN for an image by solving an energy optimization problem over a directed graphical
model. The output ORN can be regarded as an instantiation
of the guide ontology with respect to the input image. Fig. 1
illustrates three web images and their ORNs automatically
generated by our system.
Object Relation Networks can be applied to many web
applications that need automatic image understanding. In
particular, we demonstrate three typical applications:
Automatic image tagging: With a few simple inference
rules, ORNs can automatically produce informative tags describing entities, actions, and even scenes in images.
Automatic image description generation: Natural
language description of an image can be automatically generated based on its ORN, using a simple template based
approach.
Image search by image: Given a query image, the objective is to find images semantically-similar to the query
image from a image library. We show that the distance
between ORN graphs is an effective measurement of image
semantic similarity. Search results consist of images with
ORNs that are close to the query image’s ORN, ranked by
ORN distances.
The main contributions of this paper include:
1. We propose and exploit Object Relation Network towards automatic web image understanding. ORN is
an intuitive and expressive graph model in representing the semantics of web images. It presents the most
probable meaning of image objects and their relations,
while maintaining the semantic consistency through
the network.
2. We combine ontological knowledge and image visual
features into a probabilistic graphical model. By solving an optimization problem on this graphical model,
our method automatically transfers rich semantics in
the ontology to a raw image, generating an ORN in
which isolated objects detected from the image are
connected through meaningful relations.
3. We propose and demonstrate three application scenarios that can benefit from ORNs: automatic image tagging, automatic image description generation, and image search by image.
2. RELATED WORK
Our work is related to the following research areas.
Image understanding with keywords and text: Some
research achievements have been made in the web community towards understanding web image semantics with keywords and text, such as tag recommendation, tag ranking
and transfer learning from text to images. Tag recommendation [24, 29] enriches the semantics carried by existing tags
by suggesting similar tags. Tag ranking [15, 28] identifies
the most relevant semantics among existing tags. Transfer
learning from text to images [19] builds a semantic linkage
between text and image based on their co-occurrence. These
methods all require images to have meaningful initial tags
or relevant surrounding text, and thus do not work for untagged images or images with irrelevant text surrounded.
Image understanding using visual appearance: Computer vision community has made great progress in automatically identifying static objects in images, also known as object detection. The PASCAL visual object classes challenge
(VOC) is an annual competition to evaluate the performance
of detection approaches. For instance, in the VOC2011
challenge [5], detectors are required to detect twenty object classes from over 10,000 flickr images. These efforts
have made object detectors a robust and practical tool for
extracting generic objects from images (e.g., [8]). On the
other hand, detection and segmentation are usually localized operations and thus lose information about the global
structure of an image. Therefore, contextual information is
introduced to connect localized operations and the global
structure. In particular, researchers implicitly or explicitly
introduce a probabilistic graphical model to organize pixels, regions, or detected objects. The probabilistic graphical
model can be a hierarchical structure [27, 14], a directed
graphical model [26], or a conditional random field [10, 20,
11, 12]. These methods are similar in spirit to our method,
however, there are two key differences: (1) we introduce ontology to provide semantics for both relations and objects,
while previous research (even with an ontology [18]) focuses
on spatial relationships, such as on-top-of, beside, which are
insufficient to satisfy the semantic demand of web applications; (2) previous research usually focuses on improving
local operations or providing a general description for the
entire scene, they do not explicitly reveal the semantic relations between objects thus are less informative than our
Object Relation Network model.
Ontology-aided image annotation: A number of annotation ontologies (e.g., [23, 21]) have been proposed to
provide description templates for image and video annotation. Concept ontology [6] characterizes the inter-concept
correlations to help image classification. Lexical ontologies,
particularly the WordNet [7] ontology, describe the semantic hierarchies of words. WordNet groups words into sets of
synonyms and records different semantic relations between
them, such as antonymy, hypernymy and meronymy. The
WordNet ontology has been used to: (1) improve or extend existing annotations of an image [25, 3], (2) provide
knowledge about the relationships between object classes for
object category recognition [17], and (3) organize the structure of image database [4]. Different from the prior work,
we exploit ontologies to provide background knowledge for
automatic image understanding. In particular, the key difference between our guide ontology and the ontology in [17]
is that our guide ontology contains semantic hierarchies of
both object classes and relation classes, and supports various
semantic constraints.
3.
SYSTEM OVERVIEW
An overview of our system is illustrated in Fig. 2. Taking
an unannotated image (Fig. 2(a)) as input, our system first
employs a number of object detectors to detect generic objects from the input image (Fig. 2(b)). The guide ontology
(Fig. 2(c), detailed in Section 4) contains useful background
knowledge such as semantic hierarchies and constraints related to the detected objects and their relations. Our system then constructs a directed graphical model as a primi-
(a) Input
(b) Detection
(d) Directed graphical model
P(o1 ⇝ BasketballPlayer) = 0.44
P(o1 ⇝ Person) = 0.37
P(o1 ⇝ SoccerPlayer) = 0.19
o1 (Person1)
(e) Energy
optimization
towards the best
labeling
object node
relation node
(f) Output: Object
Relation Network
BasketballPlayer1
r1,2
o2 (Ball1)
P(o2 ⇝ Ball) = 0.52
P(o2 ⇝ Basketball) = 0.30
P(o2 ⇝ SoccerBall) = 0.18
E(L) = Ec (L;Ont)
+ Ei (L;Ont)
+ Ev (L;Img)
P(r1,2 ⇝ Throw) = 0.47
P(r1,2 ⇝ Head) = 0.21
P(r1,2 ⇝ Non-Interact) = 0.14
P(r1,2 ⇝ Hold) = 0.10
P(r1,2 ⇝ Kick) = 0.08
P(r1,2 ⇝ Interact) = 0.00
throw
Basketball1
(g) Applications
(c) Guide ontology
Automatic description generation
Automatic tagging
basketball
basketball player
ball throwing
A basketball player is
throwing a basketball.
Image search by image
query image
search results (ranked by relevance)
Figure 2: System pipeline for an example image: (a) the input to our system is an image with no metadata;
(b) object detectors find generic objects; (c) the guide ontology contains background knowledge related to
the detected objects and their relations; (d) a directed graphical model is constructed; (e) the best labeling of
the graph model is predicted using energy minimization; (f ) the output Object Relation Network represents
the most probable yet ontologically-consistent class assignments for the directed graph model; (g) typical
applications of ORNs.
tive relation network among the detected objects (Fig. 2(d)).
We define a set of energy functions to transfer two kinds of
knowledge to the graphical model: (1) background knowledge from the guide ontology, and (2) probabilities of potential ontological class assignments to each node, estimated
from visual appearance of the node. Definitions of these energy functions are detailed in Section 5. By solving an energy minimization problem (Fig. 2(e)), we achieve the best
labeling over the graphical model, i.e., the most probable
yet ontologically-consistent class assignments over the entire node set of the graphical model. The Object Relation
Network (ORN) is generated by applying the best labeling
on the graphical model (Fig. 2(f)), as the output of our system. The ORN can also be regarded as an instantiation of
the guide ontology. Finally, we propose and demonstrate
three application scenarios of ORNs, including automatic
image tagging, automatic image description generation, and
image search by image (Fig. 2(g)).
4. GUIDE ONTOLOGY
The source of semantics in our system is a guide ontology. It provides useful background knowledge about image
objects and their relations. An example guide ontology is
shown in Fig. 2(c).
In general, guide ontologies should have three layers. The
root layer contains three general classes, Object, OO-Relation,
and Object Collection, denoting the class of image objects,
the class of binary relations between image objects, and the
class of image object collections, respectively. The detection
layer contains classes of the generic objects that can be de-
tected by the object detectors in our system. Each of these
class is an immediate subclass of Object, and corresponds
to a generic object (e.g., person and ball ). The semantic
knowledge layer contains background knowledge about the
semantic hierarchies of object classes and relation classes,
and the constraints on relation classes. Each object class
at this layer must have a superclass in the detection layer,
while each relation class must be a subclass of OO-Relation.
Conceptually, any ontology regarding the detectable objects and their relations can be adapted into our system as
part of the semantic knowledge layer, ranging from a tiny
ontology which contains only one relation class with a domain class and a range class, to large ontologies such as
WordNet [7]. However, ontologies with more hierarchical
information and more restrictions are always preferred since
they carry more semantic information. Our system supports
four typical types of background knowledge in the guide ontology:
• Subsumption is a relationship where one class is a
subclass of another, denoted as A ⊑ B. E.g., Basketball Player is a subclass of Athlete.
• Domain/range constraints assert the domain or
range object class of a relation class, denoted as
domain(C) and range(C). E.g., in Fig. 2(c), the domain and the range of Kick must be Soccer Player and
Soccer Ball respectively.
• Cardinality constraints limit the maximum number
of relations of a certain relation class that an object
can have, where the object’s class is a domain/range of
the relation class. E.g., in Fig. 2(c), Basketball Player
o
≤1
1
(Person1)
r2,3
• Collection refers to a set of image objects belonging
to the same object class, denote as collection(C).
r1,3
o
3
(Ball1)
5. DIRECTED GRAPHICAL MODEL
The core of our system is a directed graphical model G =
(V, E). It is a primitive relation network connecting the
detected objects through relations. In particular, given a set
of detected objects {Oi } in the input image, we create one
object node oi for each object Oi , and one relation node ri,j
for each object pair < Oi , Oj > that has a corresponding
relation class in the detection layer of the guide ontology
(e.g., object pair <person1,ball1 > corresponding to class PB Relation), indicating that the two objects have potential
relations. For each relation node ri,j , we create two directed
edges (oi , ri,j ) and (ri,j , oj ). These nodes and edges form
the basic structure of G.
We now consider a labeling problem over the node set V
of graph G: for each node v ∈ V , we label it with a class
assignment from the subclass tree rooted at the generic class
corresponding to v. In particular, we denote the potential
class assignments for object node oi as C(oi ) = {Co |Co ⊑
Cg (Oi )}, where Cg (Oi ) is the generic class of object Oi
(e.g., Person for object person1 ). Similarly, the set of potential class assignments for relation node ri,j is defined as
C(ri,j ) = {Cr |Cr ⊑ Cg (Oi , Oj )}, where Cg (Oi , Oj ) is the
corresponding relation class in the detection layer (e.g., P-B
Relation). A labeling L : {v
C(v)} is feasible when we
have C(v) ∈ C(v) for each node v ∈ V .
The best feasible labeling Loptimal is required to (1) satisfy
the ontology constraints, (2) be as informative as possible,
and (3) maximize the probability of the class assignment on
each node regarding visual appearance. We predict Loptimal
by minimizing an energy function E over labeling L with
respect to an image Img and a guide ontology Ont:
E(L) = Ec (L; Ont) + Ei (L; Ont) + Ev (L; Img)
o
2
(Person2)
−−−−−→ Throw means that a Basketball Player can
have at most one Throw relation.
(1)
representing the sum of the constraint energy, the informative energy, and the visual energy; which are detailed in the
following subsections respectively.
5.1 Ontology based energy
We define energy functions based on background knowledge in the guide ontology Ont.
Domain/range constraints restrict the potential class
assignments of a relation’s domain or range. Thus, we define
a domain-constraint energy for each edge e = (oi , ri,j ) and
a range-constraint energy for each edge e = (ri,j , oj ):
{
0
if Co ⊑ domain(Cr )
EcD (oi
Co , ri,j
Cr ) =
∞
otherwise
{
0
if Co ⊑ range(Cr )
EcR (ri,j
Cr , oj
Co ) =
∞
otherwise
Intuitively, they add strong penalty to the energy function
when any of the domain/range constraints is violated.
Cardinality constraints restrict the number of instances
of a certain relation class that an object can take. We are
particularly interested in cardinality constraint of 1 since it
is the most common case in practice. In order to handle this
o
o
1
(Person1)
2
(Person2)
r1,3
r2,3
o
3
(Ball1)
Figure 3: Given an image with detected objects
shown in left, and the cardinality constraint Throw
≤1
←−−−−−− Basketball, we add an edge between node
pair (r1,3 , r2,3 ) and penalize the energy function if
both nodes are assigned as Throw.
type of constraints, we add additional edges as shown in
Fig. 3. In particular, if a relation class Cr has a cardinality
constraint being 1 with its domain (or range), we create an
edge between any relation node pair (ri,j , ri,k ) (or (ri,j , rk,j )
when dealing with range) in which both nodes have a same
domain node oi (or range node oj ) and both nodes have potential of being labeled with relation class Cr . A cardinality
constraint energy is defined on these additional edges:
{
∞
if C1 = C2 = Cr
C1 , ri,k
C2 ) =
EcD Card (ri,j
0
otherwise
{
∞
if C1 = C2 = Cr
C1 , rk,j
C2 ) =
EcR Card (ri,j
0
otherwise
Intuitively, they penalize the energy function when two relations are assigned as Cr and have the same domain object
(or range object).
Depth information, defined as the depth of a class assignment in the subclass tree rooted at its generic class. Intuitively, we prefer deep class assignments which are more
specific and more informative. In contrast, general class assignments with small depth should be penalized since they
are less informative and thus may be of less interest to the
user. In the extremely general case where generic object
classes are assigned to the object nodes and OO-Relation
is assigned to all the relation nodes, the labeling is feasible
but should be avoided since little information is revealed.
Therefore, we add an energy function for each node oi or
ri,j concerning depth information:
EiO (oi
Co ) = −ωdep · depth(Co )
EiR (ri,j
Cr ) = −ωdep · depth(Cr )
Collection refers to a set of object nodes with the same
class assignment. Intuitively, we prefer collections with larger
size as they tend to group more objects in the same image to
the same class. For example, in Fig. 4, when the two persons
in the front are labeled with Soccer Player due to the strong
observation that they may Kick a Soccer Ball ( how to make
observations from visual features is detailed in Sec 5.2), it is
quite natural to label the third person with SoccerP layer
as well since the three of them will form a relatively larger
Soccer Players Collection. In addition, we bonus collections
that are deeper in the ontology, e.g., we prefer Soccer Players Collection to Person Collection. To integrate collection
information into our energy minimization framework is a bit
complicated since we do not explicitly have graph nodes for
o
o
1
(Person1)
2
(Person2)
o3
o
o
1
(Person1)
(Person3)
r1,4
r3,4
2
(Person2)
o3
(Person3)
r2,4
r1,4
o
r3,4
r2,4
C∈C(oi )
o
4
(Ball1)
4
(Ball1)
Figure 4: Edges are added between object nodes
that have the potential to form a collection. Energy
bonus is given when the labeling results in a large
and informative collection.
collections. Therefore, we add edges between object nodes
(oi , oj ) when they belong to the same generic object class
that has the potential to form a collection (e.g., Fig. 4 right),
and define an energy function for each such edge:
C1 , oj
C2 ) =
EiCol (oi
{
−ωcol N 2−1 depth(collection(Co ))
0
(ri,j ,oj )
∑
+
EcD Card
(ri,j ,ri,k )
Ei (L; Ont) =
∑
oi
EiO
+
∑
ri,j
∑
+
EcR Card(2)
(ri,j ,rk,j )
EiR
+
∑
EiCol
(3)
(oi ,oj )
5.2 Visual feature based energy
Besides background knowledge from the ontology, we believe that visual appearance of objects can give us additional
information in determining class assignments. E.g., a Ball
with white color is more likely to be a Soccer Ball, while the
relation between two spatially close objects are more probable to be Interact than Non-interact. Thus, we define visual
feature based energy functions for object nodes and relation
nodes respectively.
Visual feature based energy on object nodes: for
each object node oi , we collect a set of visual features Fo (Oi )
of the detected object Oi in the input image, and calculate a
probability distribution over potential assignment set C(oi )
based on Fo (Oi ). Intuitively, the conditional probability
function P (oi
Co |Fo (Oi )) denotes the probability of oi
assigned as class Co when Fo (Oi ) is observed from the image.
Thus, we define the visual feature based energy on an object
node as:
EvO (oi
Co ) = −ωobj P (oi
where Cg (Oi ) is the generic class of Oi , and oi ⊑ Cg (Oi ) is
the notation for “oi is assigned as a subclass of Cg (Oi )”.
We take advantage of the hierarchical structure of the subclass tree rooted at Cg (Oi ), and compute the probability distribution in a top-down manner. Assume P (oi ⊑ Co |Fo (Oi ))
is known for certain object class Co ; if Co is a leaf node in
the ontology (i.e., Co has no subclass), we have P (oi
C|Fo (Oi )) = P (oi ⊑ Co |Fo (Oi )); otherwise, given Co ’s immediate subclass set I(Co ), we have a propagation equation:
P (oi ⊑ Co |Fo (Oi )) = P (oi
Co |Fo (Oi ))
∑
+
P (oi ⊑ Ck |Fo (Oi ))
Ck ∈I(Co )
if C1 = C2 = Co
otherwise
where ωcol is a weight, and N 2−1 is a normalization factor
with N representing the number of object nodes that can be
potentially labeled with Co .
Finally, the ontology based constraint energy Ec (L; Ont)
and informative energy Ei (L; Ont) are the sum of these energy functions:
∑
∑
Ec (L; Ont) =
EcD +
EcR
(oi ,ri,j )
Given these eight feature values on an object node oi ,
a probability distribution over the potential assignment set
C(oi ) is estimated, which satisfies:
∑
P (oi
C|Fo (Oi )) = P (oi ⊑ Cg (Oi )|Fo (Oi )) = 1
Co |Fo (Oi ))
We choose eight visual features of Oi to form feature set
Fo (Oi ), including: width and height of Oi ’s bounding box
(which is part of the output from detectors); the average of
H,S,V values from the HSV color space; and the standard
deviation of H,S,V.
We can view the right-hand side of this equation from the
perspective of multi-class classification: given conditions oi ⊑
Co and Fo (Oi ), the assignment of oi falls into |I(Co )| + 1
categories: oi
Co , or oi ⊑ Ck where Ck ∈ I(Co ), k =
1, . . . , |I(Co )|. Thus we can train a multi-class classifier
(based on object visual features) to assign a classification
score for each category, and apply the calibration method
proposed in [30] to transform these scores into a probability distribution over these |I(Co )| + 1 categories. Multiplied
by the prior P (oi ⊑ Co |Fo (Oi )), this probability distribution determines the probability functions on the right-hand
side of Eqn.(4). Thus, the probabilities recursively propagate from the root class down to the entire subclass tree, as
demonstrated in Fig. 5.
In order to train a classifier for each non-leaf object class
Co , we collect a set of objects Otrain belonging to class
Co from our training images with ground truth labeling,
and calculate their feature sets. The training samples are
later split into |I(Co )| + 1 categories regarding their labeling: assigned as Co , or belonging to one of Co ’s immediate subclasses. We follow the suggestions in [30] to train
one-against-all SVM classifiers using a radial basis function
as kernel [22] for each category, apply isotonic regression
(PAV [1]) to calibrate classifier scores, and normalize the
probability estimates to make them sum to 1. This training
process is made for every non-leaf object class once and for
all.
Visual feature based energy on relation nodes can
be handled in a similar manner to that on object nodes.
The only difference is the feature set Fr (Oi , Oj ). As for
relations, the relative spatial information is most important.
Therefore, Fr (Oi , Oj ) contains eight features of object pair
< Oi , Oj >: the width, height and center (both x and y
coordinates) of Oi ’s bounding box; and the width, height
and center of Oj ’s bounding box.
Similarly, training samples are collected and classifiers
are trained for each non-leaf relation class Cr in the ontology. With these classifiers, probabilities propagate from
each generic relation class to its entire subclass tree to form
a distribution over the potential assignment set C(ri,j ). The
visual feature based energy on ri,j is defined as:
EvR (ri,j
Cr ) = −ωrel P (ri,j
Cr |Fr (Oi , Oj ))
P(o1 ⊑ Person) = 1
P(o1 ⊑ Person) = 1
P(o1 ⊑ Person) = 1
Person
Person
Person
P(o1 ⇝ Person) = 0.37
P(o1 ⊑ Athlete) = 0.63
Athlete
o1
(Person1)
P(o1 ⇝ Person) = 0.37
P(o1 ⊑ Athlete) = 0.63
r1,2
Athlete
P(o1 ⇝ Athlete) = 0.0
o2
Soccer
Player
(Ball1)
Basketball
Player
P(o1 ⇝ SoccerPlayer) = 0.19 P(o1 ⇝ BasketballPlayer) = 0.44
Figure 5: The probability distribution over person1 ’s potential class assignments is estimated in
a top-down manner.
Finding the best labeling Loptimal to minimize the energy
function E(L) is an intractable problem since the search
space of labeling L is in the order of |C||V | , where |C| is the
number of possible class assignments for a node and |V | is
the number of nodes in graph G. However, we observe that
this space can be greatly reduced by taking the ontology
constraint energies into account. The brute-force search is
pruned by the following rules:
1. For node v, when labeling v
C(v) is to be searched,
we immediately check the constraint energies on edges
touching v, and cut off this search branch if any of
these energies is infinite.
2. We want to use rule 1 as early as possible. Thus, to
pick the next search node, we always choose the unlabeled node with the largest number of labeled neighbors.
3. On each node, we sort the potential class assignments
by their visual feature based probabilities in descending order. Class assignments with large probabilities
are searched first, and those with very small probabilities (empirically, < 0.1) are only searched when no
appropriate labeling can be found in previous searches.
In our experiments, the graphical model constructed is
relatively small (usually contains a few object nodes and
no more than 10 relation nodes). The energy optimization
process executes in less than 1 second per image.
5.4 ORN generation
Given the best labeling Loptimal over graph G, an Object
Relation Network (ORN) is generated as the output of our
system in three steps:
1. We apply labeling Loptimal over graph G to produce
object and relation nodes with most probable yet semantically consistent class assignments for ORN.
2. A collection of objects is detected by finding object
nodes with the same class assignment in Loptimal . A
collection node is created accordingly, which is linked
to its members by adding edges representing the isMemberOf relationship.
P(o2 ⇝ Ball) = 0.52
P(o2 ⇝ Basketball) = 0.30
P(o2 ⇝ SoccerBall) = 0.18
o1 ⇝ BasketballPlayer
r1,2 ⇝ Throw
o2 ⇝ Basketball
E = - 1.68
o1 ⇝ BasketballPlayer
r1,2 ⇝ Non-Interact
o2 ⇝ Ball
E = - 1.24
o1 ⇝ Person
r1,2 ⇝ Non-Interact
o2 ⇝ Ball
E = - 1.17
………...
……
3. We finally drop some meaningless relation nodes (in
particular, Non-interact), together with the edges touching them.
ri,j
5.3 Energy optimization
P(r1,2 ⇝ Throw) = 0.47
P(r1,2 ⇝ Head) = 0.21
P(r1,2 ⇝ Non-Interact) = 0.14
………...
List of Labeling
(sorted by energy)
Figure 6: The probability distributions are organized in a network to predict a most probable yet
consistent labeling, which may in return improve the
classification result.
In summary, the visual feature based energy is defined as:
∑ O ∑ R
Ev (L; Img) =
Ev +
Ev
(4)
oi
P(o1 ⇝ BasketballPlayer) = 0.44
P(o1 ⇝ Person) = 0.37
P(o1 ⇝ SoccerPlayer) = 0.19
After these steps, an intuitive and expressive ORN is automatically created from our system to interpret the semantics
of the objects and their relations in the input image. Examples are shown in Fig. 1 and Fig. 9.
6.
EXPERIMENTAL RESULTS
6.1
Energy function evaluation
We first demonstrate how visual feature based energy functions work together with ontology based energy functions,
using the example in Fig. 6. We observe that the probability distributions shown in the middle tend to give a good
estimation for each node, i.e., provide a relatively high probability for the true labeling. But there is no guarantee that
the probability of the true labeling is always the highest
(e.g., Ball1 has higher probability of being assigned as Ball
than Basketball, highlighted in red). By combining the energy functions together, the ontology constraints provide a
strict frame to restrict the possible labeling over the entire
graph by penalizing inappropriate assignments (e.g., Basketball Player Throw Ball, given that the range of relation
T hrow is limited to Basketball). Probabilities are organized
into a tightly interrelated network which in return improves
the prediction for each single node (e.g., in the labeling with
minimal energy, Ball1 is correctly assigned as Basketball ).
To quantitatively evaluate the energy functions, we collect 1,200 images from ImageNet [4] from category soccer,
basketball and ball. A person detector [9] and a ball detector
using Hough Circle Transform in OpenCV [2] are applied
on the entire image set to detect persons and balls. The detected objects and the relations between them are manually
labeled with classes from the guide ontology in Fig. 2(c).
We then randomly select 600 images as training data, and
use the rest as test data. Three different scenarios are compared: (1) using only visual feature based energy, (2) using
both visual feature based energy and ontology constraints,
and (3) using the complete energy function E(L) in Eqn. 1.
Our system minimizes the energy cost in each of the scenarios, and calculates the error rate by comparing the system
output with ground truth. As Fig. 8 and Table 1 suggest,
ontology-based energy transfers background knowledge from
the guide ontology to the relation network, and thus significantly improves the quality of class assignments.
Semantic knowledge layer
Ride
Basketball
Player
Soccer
Player
Athlete
Object
Chair
Basketball
Person-Ball
Relation
Soccer
Ball
Hold
O-O Relation
Head
Person-Motorbike
Relation
Object
Collection
Ball
Motorcyclist
Throw
Interact
Root layer
Person
Rider
Person-Horse
Relation
Motorbike
Horse
Cyclist
Horse
Rider
Lead
Kick
Detection layer
Person-Bicycle
Relation
Person
Chair
...
Ride
Collection
Collection
Athelete
Soccer Player
Basketball Player
Collection
Collection
Collection
Ride
Bicycle
Stand by
Figure 7: The ontology we use for system evaluation. Constraints are only shown in the root layer for clarity.
Error rate of class assignment
0.7
Using only Ev(L;Img)
0.6
ORN score
Detection score
Combining Ev(L;Img) and Ec(L;Ont)
Using complete energy function E(L)
0.5
0.4
k=1
3.69
4.31
k=2
3.38
3.93
k=3
3.77
3.10
k>3
3.95
3.38
overall
3.65
3.69
Table 2: Human evaluation of ORN and detection:
possible score ranges from 5(perfect) to 1(failure).
k is the number of detected objects.
0.3
0.2
0.1
0
On Person nodes
On Ball nodes
On P−B Relation nodes
Figure 8: Error rate of class assignments under three
different scenarios.
Generic
class
Person
Ball
P-B Rel.
Using
Ev
0.5188
0.2907
0.3222
Using
Ev +Ec
0.4644
0.2693
0.2887
Using
E(L)
0.3766
0.2640
0.2259
Gain
0.1423
0.0267
0.0962
Gain
(k>3)
0.1783
0.0571
0.0775
Table 1: Evaluation results of the energy functions.
The first columns contains data for Fig. 8. The last
two columns show the gain in accuracy by using the
complete energy function E(L), where k is the number of detected objects.
6.2 System evaluation
To further evaluate the robustness and generality of our
system, we adapt a more complicated guide ontology (Fig. 7)
into the system. The detection layer contains 6 generic object classes: Person, Horse, Motorbike, Chair, Bicycle, and
Ball, while the semantic layer contains simplified semantic
hierarchies from the WordNet ontology [7]. Moreover, we
extend our image set with images from VOC2011 [5] containing over 28,000 web images. We randomly choose 2,000
images that have at least one generic object, manually label
ground truth class assignments for objects and relations, and
use them to train the visual feature based classifiers and the
weight set (ωdep , ωcol , ωobj , ωrel ). We adopt the detectors
in [9, 2] to perform object detection.
Time complexity: The most time-consuming operation
of our system is detection, which usually takes around one
minute per test image. After this pre-processing, our system automatically creates an ORN for each image within a
second. All experiments are run on a laptop with Intel i-7
CPU 1.60GHz and 6GB memory.
Qualitative results: Most of our ORNs are quite good.
Example results are shown in Fig. 9. The “Good” ORNs in
the first four columns successfully interpret the semantics of
the objects and their relations. We also demonstrate some
“bad” examples in the last column. Note that the “bad”
results are usually caused by detection errors (e.g., the top
image has a false alarm from the person detector while the
rest two images both miss certain objects). Nevertheless,
the “bad” ORNs still interpret reasonable image semantics.
Human evaluation: We perform human judgement on
the entire test data set. Scores on a scale of 5 (perfect) to 1
(failure) are given by human judges to reflect the quality of
the ORNs, shown in Table 2. First, we notice that the ORNs
are quite satisfactory as the overall score is 3.65. Second,
ORN scores for images of a single object are relatively high
because the detection is reliable when k = 1. With the
number of objects increasing, the relation network becomes
larger and thus more ontology knowledge is brought into the
optimization process. The quality of ORN keeps improving
despite the quality drop of detection.
7.
APPLICATIONS
We present three typical web applications based on the
rich semantic information carried by ORNs, detailed as follows.
7.1
Automatic image tagging
We develop an automatic image tagging approach by combining ORNs and a set of inference rules. Given a raw image as input, our system automatically generates its ORN
which contains semantic information for the objects, relations, and collections. Thus, we directly output the ontological class assignments in the ORN as tags regarding entities,
actions, and entity groups. In addition, with a few simple
rules, implicit semantics about the global scene can also be
easily inferred from the ORN and translated into tags. Table 3 shows some example inference rules. Results from our
method and a reference approach ALIPR [13] are illustrated
in the third row of Fig. 10. Note that even with imperfect
ORNs (the 5th and 6th image), our approach is still capable
of producing relevant tags.
A Collection of
BasketballPlayers
Basketball
Basketball
Player1
Player2
Basketball
Player3
Ball3
A Collection of SoccerPlayers
SoccerPlayer1
SoccerPlayer3
Person1
Ball2
Ball1
Person1
throw
Ball4
Ball1
Ball5
ride
Ball6
Ball10
kick
Basketball1
A Collection of Balls
hold
lead
SoccerPlayer2
kick
HorseRider1
Horse1
Ball9
Ball8
SoccerBall1
Ball7
A Collection
of Persons
Person3
Person1
Person2
A Collection
of Cyclists
Cyclist2
Cyclist1
Motorcyclist1
Motorbike1
ride
A Collection of SoccerPlayers
SoccerPlayer5
SoccerPlayer1
SoccerPlayer4
SoccerPlayer2
SoccerPlayer3
SoccerBall1
A Collection of Cyclists
A Collection of Horses
Horse2 Cyclist4
ride
Horse1
Person1
Person1
ride
Bicycle2
Cyclist3 Cyclist2 Cyclist1 Person2
ride
ride
ride
Bicycle1 Bicycle2 Bicycle4 Bicycle3
A Collection of Bicycles
Person3
A
Person4 Collection
of Persons
Bicycle1
ride
Bicycle3
A Collection of Bicycles
Figure 9: Object Relation Networks are automatically generated from our system. “Good” results are
illustrated in the first four columns while the last column shows some “bad” results.
1
2
3
∃xSoccerP layerCollection(x) ∧ ∃ySoccerBall(y) ∧
∃zSoccerP layer(z) ∧ (kick(z, y) ∨ head(z, y)) ∧ T ag(t) →
t=“soccer game”
∃xCyclistCollection(x) ∧ ∃yCyclist(y) ∧ ∃zBicycle(z) ∧
ride(y, z) ∧ T ag(t) → t =“bicycle race”
∃xBasketballP layerCollection((x) ∧ ∃yBasketball(y) ∧
∃zBasketballP layer(z) ∧ (throw(z, y) ∨ hold(z, y)) ∧
T ag(t) → t=“basketball game”
Table 3: Example rules for inferencing implicit
knowledge from ORNs
7.2 Automatic image description generation
Natural language generation for images is an open research problem. We propose to exploit ORNs to automatically generate natural language descriptions for images. We
extend our automatic tagging approach by employing a simple template based model (inspired by [11]) to transform
tags into concise natural language sentences. In particular,
the image descriptions begin with a sentence regarding the
global scene, followed by another sentence enumerating the
entities (and entity groups if there is any) in the image. The
last few sentences are derived from relation nodes in the
ORN with domain and range information. Examples are
shown in the last row of Fig. 10.
7.3 Image search by image
The key in image search by image is the similarity measurement between two images. Since ORN is a graph model
that carries informative semantics about an image, the graph
distance between ORNs can serve as an effective measurement of the semantic similarity between images. Given that
ORN is an ontology instantiation, we employ the ontology
distance measurement in [16] to compute ORN distances. In
particular, we first pre-compute the ORNs for images in our
image library which contains over 30,000 images. Then for
each query image, we automatically generate its ORN, and
retrieve images with the most similar ORNs from the image library. The result images are sorted by ORN distances.
Fig. 11 illustrates several search results of our approach.
Search results from Google Image Search by Image are also
included for reference.
8.
CONCLUSION
We presented Object Relation Network (ORN) to carry
semantic information for web images. By solving an optimization problem, ORN was automatically created from a
graphical model to represent the most probable and informative ontological class assignments for objects detected from
the image and their relations, while maintaining semantic
consistency. Benefiting from the strong semantic expressiveness of ORN, we proposed automatic solutions for three
typical yet challenging image understanding problems. Our
experiments showed the effectiveness and robustness of our
system.
9.
ACKNOWLEDGMENTS
We acknowledge support from NSF grant CCF-1048311.
10.
REFERENCES
[1] M. Ayer, H. Brunk, G. Ewing, W. Reid, and
E. Silverman. An empirical distribution function for
sampling with incomplete information. Annals of
Mathematical Statistics, 1955.
[2] G. Bradski and A. Kaehler. Learning OpenCV:
Computer Vision with the OpenCV Library. O’Reilly,
Cambridge, MA, 2008.
[3] R. Datta, W. Ge, J. Li, and J. Wang. Toward bridging
the annotation-retrieval gap in image search.
Multimedia, IEEE, 2007.
Input images:
Obejct relation networks (ORNs) generated from our system:
A Collection of Cyclists
Person 1
Cyclist1
hold
Cyclist2
ride
ride
Bicycle1
Bicycle2
A Collection of SoccerPlayers
SoccerPlayer5
SoccerPlayer1
SoccerPlayer4
SoccerPlayer2
SoccerPlayer3
A Collection of Motorcyclists
SoccerBall1
Motorcyclist2
Motorcyclist1
ride
kick
SoccerBall1
A Collection of Chairs
Chair1
Chair3
Person1
Chair2
Motorbike1
SoccerBall1
A Collection of Bicycles
Automatic generated tags based on ORNs:
ball holding
soccer ball
person
soccer game
ball kicking
soccer players
soccer ball
bicycle race
bicycle riding
cyclists
bicycles
motorbike riding
motorcyclists
motorbike
chairs
soccer ball
person
building, historical, manmade, landscape, car,
beach, people, modern,
city, work
indoor, man-made,
decoration, decoy,
people, drawing,
thing, sport, cloth,
art
(Reference) Top-10 automatic annotation results from ALIPR [13]:
indoor, man-made,
flower, plant, grass,
old, poster, horse,
house, rural_England
man-made, indoor,
people, grass, sky, car,
steam, engine, food,
royal_guard
grass, people, rural,
guard, fight, battle,
flower, landscape,
plant, man-made
building, man-made,
sport, historical, car,
people, sky, plane, race,
motorcycle
Automatic generated image descriptions based on ORNs:
There are one person
and one soccer ball.
The person is holding
the soccer ball.
This is a picture of a
bicycle race. There are
two cyclists and two
bicycles. Cyclist 1 is
riding Bicycle 1. Cyclist
2 is riding Bicycle 2.
This is a picture of a soccer
game. There are five soccer
players and one soccer ball.
Soccer player 3 is kicking the
soccer ball.
There are two motorcyclists and
one motorbike. Motorcyclist 1 and
Motorcyclist 2 are riding
Motorbike 1.
There are three chairs.
There are one
person and one
soccer ball.
Figure 10: Tags and natural language descriptions automatically generated from our ORN-based approaches.
Annotation results from the ALIPR system (http://alipr.com/) are also showed for reference.
[4] J. Deng, W. Dong, R. Socher, L.-J. Li, K. Li, and
[11]
L. Fei-Fei. Imagenet: A large-scale hierarchical image
database. CVPR, 2009.
[5] M. Everingham, L. Van Gool, C. K. I. Williams,
[12]
J. Winn, and A. Zisserman. The PASCAL Visual
Object Classes Challenge 2011 (VOC2011) Results.
http://www.pascal[13]
network.org/challenges/VOC/voc2011/workshop/index.html.
[6] J. Fan, Y. Gao, and H. Luo. Integrating concept
ontology and multitask learning to achieve more
effective classifier training for multilevel image
[14]
annotation. Image Processing, IEEE Transactions on,
2008.
[7] C. Fellbaum. WordNet An Electronic Lexical Database.
The MIT Press, Cambridge, MA ; London, 1998.
[15]
[8] P. Felzenszwalb, R. Girshick, D. McAllester, and
D. Ramanan. Object detection with discriminatively
[16]
trained part based models. IEEE TPAMI, 32(9), 2010.
[9] P. F. Felzenszwalb, R. B. Girshick, and D. McAllester.
[17]
Discriminatively trained deformable part models,
release 4.
[18]
http://www.cs.brown.edu/~pff/latent-release4/.
[10] X. He, R. S. Zemel, and M. A. Carreira-Perpinan.
Multiscale conditional random fields for image
[19]
labeling. In CVPR, 2004.
G. Kulkarni, V. Premraj, S. Dhar, S. Li, Y. Choi,
A. C. Berg, and T. L. Berg. Baby Talk: Understanding
and Generating Image Descriptions. In CVPR, 2011.
L. Ladicky, P. Sturgess, K. Alahari, C. Russell, and
P. H. Torr. What, where and how many? combining
object detectors and crfs. In ECCV, 2010.
J. Li and J. Z. Wang. Real-time computerized
annotation of pictures. In Proceedings of the 14th
annual ACM international conference on Multimedia,
2006.
L.-J. Li, R. Socher, and L. Fei-Fei. Towards total scene
understanding: Classification, annotation and
segmentation in an automatic framework. In CVPR,
2009.
D. Liu, X.-S. Hua, L. Yang, M. Wang, and H.-J.
Zhang. Tag ranking. In WWW, 2009.
A. Maedche and S. Staab. Measuring similarity
between ontologies. In EKAW, 2002.
M. Marszalek and C. Schmid. Semantic hierarchies for
visual object recognition. In CVPR, 2007.
I. Nwogu, V. Govindaraju, and C. Brown. Syntactic
image parsing using ontology and semantic
descriptions. In CVPR, 2010.
G.-J. Qi, C. Aggarwal, and T. Huang. Towards
Query image
ORN
Top-4 search results
Our approach
HorseRider1
ride
Google Image Search by Image
Horse1
Our approach
A Collection of Chairs
Google Image Search by Image
Chair1
Chair2
Chair4
Chair3
Our approach
A Collection of
SoccerPlayers
Soccer
Player2
Soccer
Player1
Soccer
Player3
kick
Google Image Search by Image
kick
SoccerBall1
Figure 11: Image search results of our approach and Google Image Search by Image
[20]
[21]
[22]
[23]
[24]
semantic knowledge propagation from text corpus to
web images. In WWW, 2011.
A. Rabinovich, A. Vedaldi, C. Galleguillos,
E. Wiewiora, and S. Belongie. Objects in context. In
ICCV, 2007.
C. Saathoff and A. Scherp. Unlocking the semantics of
multimedia presentations in the web with the
multimedia metadata ontology. In WWW, 2010.
B. Schölkopf and A. J. Smola. Learning with Kernels:
Support Vector Machines, Regularization,
Optimization, and Beyond. The MIT Press,
Cambridge, MA, 2002.
A. T. G. Schreiber, B. Dubbeldam, J. Wielemaker,
and B. Wielinga. Ontology-based photo annotation.
IEEE Intelligent Systems, 2001.
B. Sigurbjörnsson and R. van Zwol. Flickr tag
recommendation based on collective knowledge. In
WWW, 2008.
(http://images.google.com/)
[25] M. Srikanth, J. Varner, M. Bowden, and D. Moldovan.
Exploiting ontologies for automatic image annotation.
In SIGIR, 2005.
[26] A. Torralba, K. Murphy, and W. T. Freeman. Using
the forest to see the trees: exploiting context for visual
object detection and localization. In Commun. ACM,
2010.
[27] Z. Tu, X. Chen, A. Yuille, and S. Zhu. Image parsing:
Unifying segmentation, detection, and recognition.
IJCV, 2005.
[28] J. Weston, S. Bengio, and N. Usunier. Large scale
image annotation: Learning to rank with joint
word-image embeddings. European Conference on
Machine Learning, 2010.
[29] L. Wu, L. Yang, N. Yu, and X.-S. Hua. Learning to
tag. In WWW, 2009.
[30] B. Zadrozny and C. Elkan. Transforming classifier
scores into accurate multiclass probability estimates.
In ACM SIGKDD, 2002.
