General Mills
advertisement
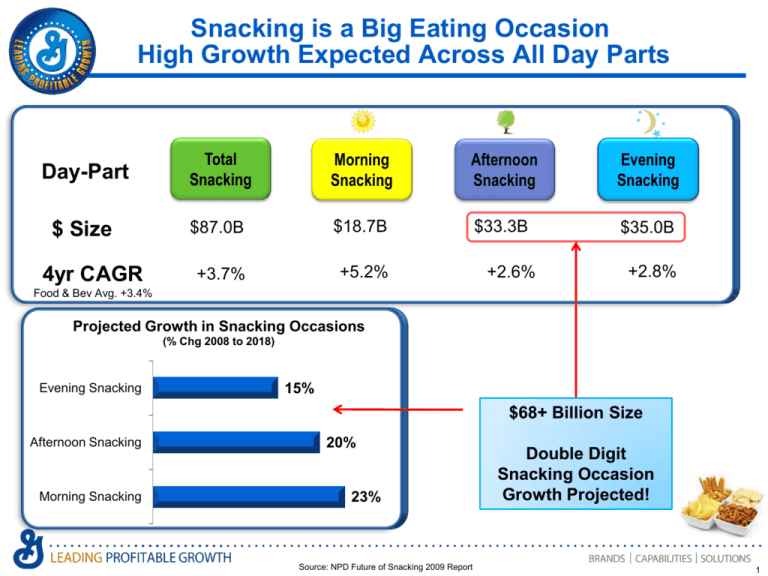
Snacking is a Big Eating Occasion High Growth Expected Across All Day Parts Day-Part Total Snacking Morning Snacking Afternoon Snacking Evening Snacking $ Size $87.0B $18.7B $33.3B $35.0B +3.7% +5.2% 4yr CAGR +2.6% +2.8% Food & Bev Avg. +3.4% Projected Growth in Snacking Occasions (% Chg 2008 to 2018) Evening Snacking 15% $68+ Billion Size Afternoon Snacking Morning Snacking 20% 23% Source: NPD Future of Snacking 2009 Report Double Digit Snacking Occasion Growth Projected! 1 Snacking is Big & Growing, Driven by Better For You (BFY) • Snack Food Categories are $150 Billion business • Snacks, particularly Better for You Snacks are outpacing total food growth Snack Food Categories $150B Projected Food Growth Rate CAGR 2010 - 2020 Total Food $63B $87B Breakfast Lunch / Dinner Snacks BFY Snacks Source: General Mills Consumer Insights 3.4% 3.0% 3.3% 3.7% 5.4% 2 Growth Driven by Long Term Trends & Need State Evolution Consumers More Open to Snacking Old View…The Problem New View…The Solution • Snacks: Empty, high calories • Snacking: Real foods, benefits, reduced calories • Mindless Eating • Healthy “Better For You” Snacking • Increased eating occasions, concern about when eating • Balancing food intake to regulate energy levels and cravings Source: General Mills Consumer Insights 3 Consumer Desire for Healthier Food Options is Increasing… Better For You continues to be an emerging consumer trend • Nearly all are trying to improve at least one aspect of their eating habits1 • More than half of Americans are trying to lose weight1 • Consumer Desire for Healthier Food Options is Increasing2 Stores should carry more healthy snacks/food options2 3 (% who agree) 64 72 68 Male 75 Female 2007 2010 Source (1): IFICF 2012 Food & Health Survey Source (2): Mintel Convenience Stores Report, 2007 and Mintel Attitudes Toward Convenience Store Shopping, April 2011 Source (3): Mintel Attitudes Toward Healthy Food – June, 2012 4 Consumers Spend Starting to Match What They Are Saying… BFY items outpacing category growth1 BFY growth vs. Category Projected Food Category Growth Rates 2010-2020 45% 38% 40% Breakfast 35% % vs. LY 30% These trends are expected to continue moving forward2 3.0% 29% 25% Lunch / Dinner 3.3% 20% 15% 10% 11% Snacks 3.7% 8% 5% BFY Snacks 0% Warehouse Salty BFY % chg LY 5.4% Grain Category % chg LY Total Yogurt category growing 33% vs. LY1 Better For You = “Healthier Than” Snacks items with Low-Calorie, Clean Label/Simple Ingredients and other healthy essential to provide consumers with energy to get them through the day. Source(1): IRI Latest 52 weeks ending 7/19/12 Source (2): State of Snacks Study: December 2011 5 Vending Consumers want Better for You Options, and some are willing to pay more for these products Implication: Need to make sure Better For You Snack Options are available in Machine – Can be as simple as Pretzels, 100 Calorie Snack Pack and Whole Grain Granola Bar 76% Vending Consumers seek Better for You Snacks 40% willing to pay more 26% Not sure if they would pay more 2/3rds of Consumers chose Better For You Snack at least half the time Broad definition of Better for You Snacks, although most consumers would say it hits on at least one of these 3 items Low Fat Low Calories Whole Grain Automatic Merchandiser, Shapiro Study 2009 Carry Top Better For You General Mills SKUs in Appropriate Categories Cereal Grain Fruit Snacks Salty Yogurt 7 Yogurt Growth has been a Long-term Trend, Driven by 3 Key Segments Category $ Sales (Millions) Store Historical Growth Trend $45 $40 $35 $30 $25 $20 $15 $10 $5 $2008 2009 GREEK • • • • 20% of Retail Unit Volume Protein Benefits #1 Growing Retail Segment High Cross Purchase 2010 2011 REGULAR • • • • 19% of Retail Unit Volume Taste Maintains broad appeal Hispanics LIGHT • • • • 19% of Retail Unit Volume Weight Management Healthy Living Boomers & Empty Nesters 8 : IRI Total US Calendar 2008-2011; AC Nielsen Save Mart/Lucky Corp 13 Weeks Ending 5/26/12; Yoplait Nielsen AO Bi-Weekly Report, 7/14/12 Yogurt is a go-to healthy snack, and growing Average person consumes >2 snacks per day, of which most are “healthy” 2.55 2.55 2.54 All Male Yogurt is amongst the largest snack segments, and growing fastest Female Dollar Sales Ranking 1.81 1.79 1.83 Snacks 9 Annual Growth Average snacks in a day Healthy snacks in a day Source: Mintel Healthy Snacking Consumer, December, 2011 Yogurt amongst Top 4 snack options considered “healthy” #1 #2 #3 #4 Fresh Fruit Raw Vegetables Nuts/Seeds Yogurt 86% 73% 71% 70% Source: Mintel Healthy Snacking Consumer, December, 2011 1. Choc Candy +6% 2. Cookies +2% 3. Rem Snacks +4% 4. Fresh Produce +7% 5. Non Choc Cndy +6% 6. Ice Cream 7. Frz Novelties +4% 8. Potato Chips +3% 9. YOGURT +9% 10. Chewing Gum -2% 0% 9 Source: GMI Occasion Landscape, Nielsen, Year Ending 5.2011 Yogurt Growth is Driven by Consumers 80% of US Households Buy Yogurt1 Consumption Has Doubled Over Last 10 Years2 U.S. Household Penetration (%) +7.5 66.6 74.1 Consumption per Capita +120% +6.3 80.2 Trips +138% 41 $ / Trip 22 19 14 also growing! Females 2000 2005 +111% 34 10 Children 2001 2011 Top 3 Benefits: Health, Taste, Convenience3 Males 2011 Still Room to Grow Consumption4 Yogurt Per Capita Consumption (Lbs) Weight Loss Calcium Protein Digestive Health Fruit/Taste Kid Fun Switzerland Finland France Sweden Portugal Spain Germany Canada Greece UK Australia Argentina Japan Italy USA Brazil Mexico 57 50 45 39 38 37 36 26 22 22 21 18 18 16 15 13 12 U.S. Opportunity to Grow vs. Countries with Similar Dairy Consumption! 1. AC Nielsen Panel 2000, 2005, 2011; 2. NPD SnackTrack 2 years ending June 2010; Children = 2-17 years of age; Adults = 18+ years; 3. The NPD Group’s National Eating Trends® 4. Euromonitor International 2012 Better For You Snacks GM is introducing items that create credibility around the health and wellness product class. Here are a few of our brands: Grain Warehouse Salty Yogurt Fruit

