AMS 102: QUIZ 1 1. What is wrong with this pie chart? All sectors
advertisement
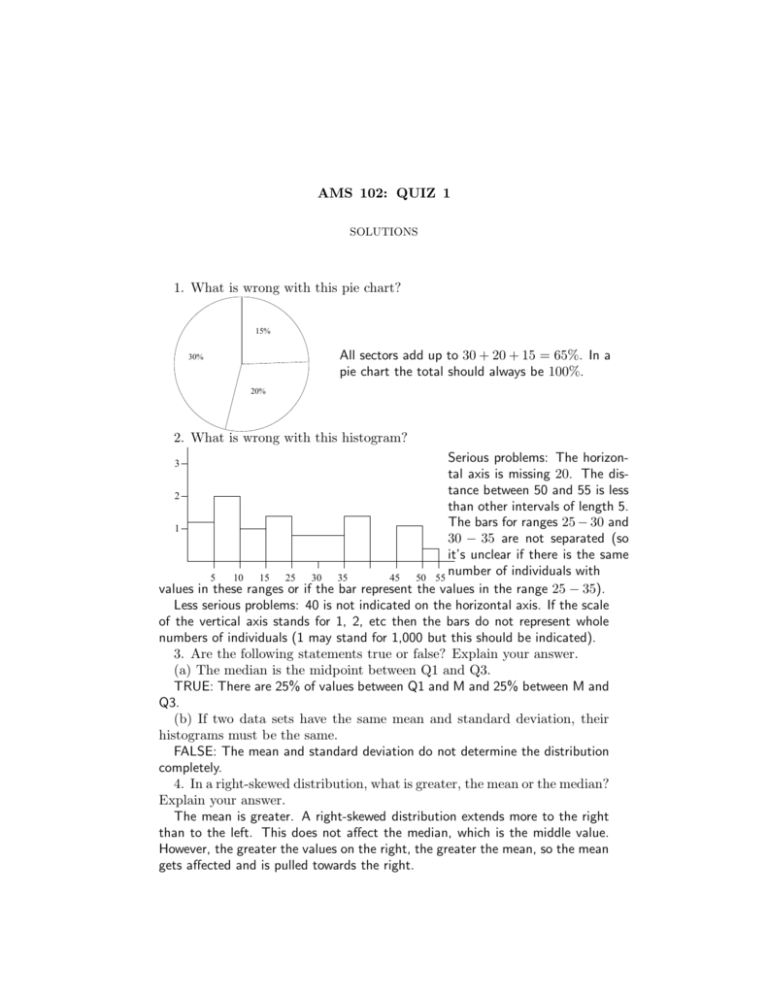
AMS 102: QUIZ 1 SOLUTIONS 1. What is wrong with this pie chart? 15% All sectors add up to 30 + 20 + 15 = 65%. In a pie chart the total should always be 100%. 30% 20% 2. What is wrong with this histogram? Serious problems: The horizontal axis is missing 20. The distance between 50 and 55 is less 2 than other intervals of length 5. The bars for ranges 25 − 30 and 1 30 − 35 are not separated (so it’s unclear if there is the same number of individuals with 5 10 15 25 30 35 45 50 55 values in these ranges or if the bar represent the values in the range 25 − 35). Less serious problems: 40 is not indicated on the horizontal axis. If the scale of the vertical axis stands for 1, 2, etc then the bars do not represent whole numbers of individuals (1 may stand for 1,000 but this should be indicated). 3. Are the following statements true or false? Explain your answer. (a) The median is the midpoint between Q1 and Q3. TRUE: There are 25% of values between Q1 and M and 25% between M and Q3. (b) If two data sets have the same mean and standard deviation, their histograms must be the same. FALSE: The mean and standard deviation do not determine the distribution completely. 4. In a right-skewed distribution, what is greater, the mean or the median? Explain your answer. The mean is greater. A right-skewed distribution extends more to the right than to the left. This does not affect the median, which is the middle value. However, the greater the values on the right, the greater the mean, so the mean gets affected and is pulled towards the right. 3
