Morton-Stat Ease Case Study Final - Stat
advertisement
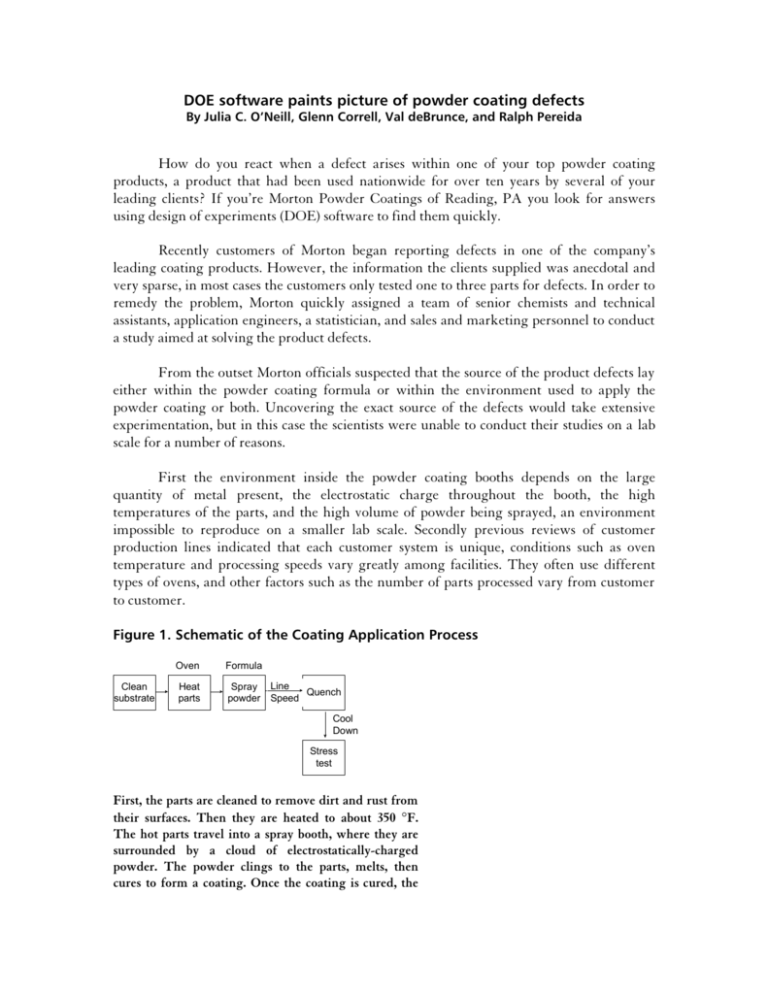
DOE software paints picture of powder coating defects By Julia C. O’Neill, Glenn Correll, Val deBrunce, and Ralph Pereida How do you react when a defect arises within one of your top powder coating products, a product that had been used nationwide for over ten years by several of your leading clients? If you’re Morton Powder Coatings of Reading, PA you look for answers using design of experiments (DOE) software to find them quickly. Recently customers of Morton began reporting defects in one of the company’s leading coating products. However, the information the clients supplied was anecdotal and very sparse, in most cases the customers only tested one to three parts for defects. In order to remedy the problem, Morton quickly assigned a team of senior chemists and technical assistants, application engineers, a statistician, and sales and marketing personnel to conduct a study aimed at solving the product defects. From the outset Morton officials suspected that the source of the product defects lay either within the powder coating formula or within the environment used to apply the powder coating or both. Uncovering the exact source of the defects would take extensive experimentation, but in this case the scientists were unable to conduct their studies on a lab scale for a number of reasons. First the environment inside the powder coating booths depends on the large quantity of metal present, the electrostatic charge throughout the booth, the high temperatures of the parts, and the high volume of powder being sprayed, an environment impossible to reproduce on a smaller lab scale. Secondly previous reviews of customer production lines indicated that each customer system is unique, conditions such as oven temperature and processing speeds vary greatly among facilities. They often use different types of ovens, and other factors such as the number of parts processed vary from customer to customer. Figure 1. Schematic of the Coating Application Process Clean substrate Oven Formula Heat parts Spray Line Quench powder Speed Cool Down Stress test First, the parts are cleaned to remove dirt and rust from their surfaces. Then they are heated to about 350 °F. The hot parts travel into a spray booth, where they are surrounded by a cloud of electrostatically-charged powder. The powder clings to the parts, melts, then cures to form a coating. Once the coating is cured, the parts are cooled by a water spray. One to three parts are sampled from each lot, stress tested, and checked for visible defects. The Morton quality team decided to rent a customer line to conduct full-scale experiments aimed at finding the source of the defect. In order to control the cost of the project, the Morton scientists had to minimize the number of experimental formulas manufactured, so they turned to the aid of Design-Expert 6.0, a design of experiments (DOE) software package written by Stat-Ease, Inc, Minneapolis, MN. The software sets up designs, analyzes data, and through the use of various tables and graphs is able to illustrate key factors in improving processes or products. In this client’s case the Morton researchers suspected that the powder coating defect lay within the formulation of the powder itself, such as the level of catalyst, the amount of a certain proprietary additive in the formula or the coarseness of the powder. Speaking in design of experiments terms, each of these ingredients is a variable, and each variable could be mixed into the powder formula at an infinite number of ratios. The researchers only had the use of the customer line for two shifts, so they needed to collect data under as many different conditions as possible within the time allowed. Putting a different powder coating formula into the system is much harder than changing the line speed or oven temperature. Completely random experimentation of all of the possible combinations of these ingredients requires emptying out and cleaning the entire coating system each time the formulas are changed, a process that can take over an hour. However, variables such as the speed of the line or the oven temperature can be dialed in and established at a new equilibrium within 15 minutes and without having to clean the system. Of course, in order to keep their experiment cost effective, Morton researchers also had to minimize the pounds of powder manufactured and potentially disposed of as waste. Therefore the choice of experiment designs was dictated by practical considerations. Rather than running a full factorial experimental design which would require running experiments on all of the possible combinations of the level of catalyst, the amount of additive, the coarseness of the powder, the line speed and the temperature of the oven, the fractional factorial design feature of Design-Expert 6.0 was used to allow the researchers to examine just a few of the possible combinations. The Morton researchers agreed to manufacture 1500 pounds of each coating formulation chosen for the trial, enough to run the line for several hours with each formula. Design-Expert 6.0 allowed the researchers to study the three ingredients in just four different formulas using a modified design, with restricted randomization, known as a split plot design. Split plot designs actually originated in the field of agriculture. Experimenters divided large areas of land, called whole plots, into smaller subplots that could be treated separately. For example, they would often plant several seed varieties, each on its own whole plot, and then apply different fertilizers on each subplot. From there they were able to study the various effects. In a split plot design, the hard-to-change factors, in this case the powder formulas, are only changed a few times. These formed the whole plot factors and are labeled here as factors A, B and C. For each formula, the easy-to-change factors, in this case the line speed (D) and oven temperature (E), are changed multiple times. These became the subplot factors. Ultimately the team found it easiest to simply test 20 parts for each combination tested. The levels for the easy-to-change factors were set at the extremes: a very fast line speed, a very slow line speed, very high oven temperature and very low oven temperature, all of which were still expected to produce an acceptable coating. The midpoint for each of these factors was the recommended oven temperature and line speed normally run by the customer. Once each of the four formulas was loaded into the coating system, all combinations of line speed and oven temperature were run. Design-Expert 6.0 made the analysis and interpretation of the results simple. For a standard factorial analysis, the software neatly presents a half-normal plot of the effects. A split-plot analysis takes a little extra effort. The experimenter takes an additional step of making two plots rather than one to correctly test all of the effects. The subplot factors are tested against the subplot error as shown in Figure 2. Then the whole plot factors are tested against the whole plot error. Since there are only the three effects with the whole plot error, the half-normal plot in Figure 3 is not very useful for separating significant effects from noise. However, it is visually clear that main effects B and C are much larger than effect A. After the experiments were performed Design-Expert 6.0 illustrated that the three largest effects on the end product were temperature, additive level, and coarseness. Measurements taken during the study indicate that temperature varies widely from part to part within a run. Similarly, variations in additive level and coarseness can occur. Past data shows that reproducibility from one manufacturing run to the next is very good. Figure 2. Half-Normal Plot of Effects with Subplot Error Half Normal plot DESIGN-EXPERT Plot Sqrt(Defects) 99 97 Half Normal % probability A: Catalyst A: Catalyst B: Additive B: Additive C: Coarseness C: Coarseness D: TimetoQuench Line Speed D: E o o t h ETemp. xitTemp E:: B Oven E 95 90 85 80 70 60 40 20 0 0.00 0.13 0.27 |Effect| 0.40 0.53 Figure 2 shows that the effect of temperature (E) is much greater than the other subplot factor effects. Figure 3 clearly illustrates that main effects of additive B and coarseness C are much larger than effect A. Figure 3. Half-Normal Plot of Effects with Whole Plot Error Half Normal plot DESIGN-EXPERT Plot Sqrt(Defects) D: Line Speed E: Oven Temp. 97 95 Half Normal % probability A: Catalyst B: A: Additive Catalyst C: Coarseness B: Additive D: TimetoQuench C: Coarseness E: BoothExitTemp 99 90 B 85 80 70 C 60 40 A 20 0 0.00 0.12 0.25 0.37 0.50 |Effect| The main implications of this study were unambiguous. Higher temperatures produce more defects. Morton now recommends that all customers using this product reduce their application temperature by about 50°F. This results in the added advantage of significant energy savings. Theoretical calculations of heat transfer indicate that this should yield a nearly 10-percent reduction in energy requirements for the coating process. Design-Expert 6.0 also unveiled some clear implications for the product formulation. Higher levels of the additive produce more defects. The Morton researchers suspect that there is an interaction between the additive level and the particle coarseness. The additive tends to remain on the surface of the particles. When particles are ground finer, their surface area increases. Finer particles may be able to carry a higher level of additive on their surface. Coarse particles may reach a limit on how much additive they can carry; the excess additive could create sites for the formation of defects. This means when the additive level is low, the coarseness has little effect on the defect rate. Since coarseness is difficult to control in the manufacturing process, Morton has found that it can make the product more robust by decreasing the additive level in the formula. From the start the researchers had some initial trepidation testing many parts for defects in front of their customers, since even the best coating formulas would produce an occasional defect if tested on enough parts. However, designing experiments with Design-Expert 6.0 on the customer’s line proved to be a very powerful way to melt the operators’ resistance to changing application conditions. When the operators could see and touch the best-performing parts, the Morton researchers had no trouble convincing them to incorporate the application changes into their operating procedure. For more information contact: Stat-Ease, Inc. 2021 East Hennepin Ave., Suite 480 Minneapolis, MN 55413 p: 612.378.9449, f: 612.378.2152 w: http://www.statease.com Morton Powder Coatings 3 Commerce Drive Reading, PA 19607 w: http://www.mortonpowder.com

