Modern_atmospheric_CO2_record_MLAB.doc
advertisement

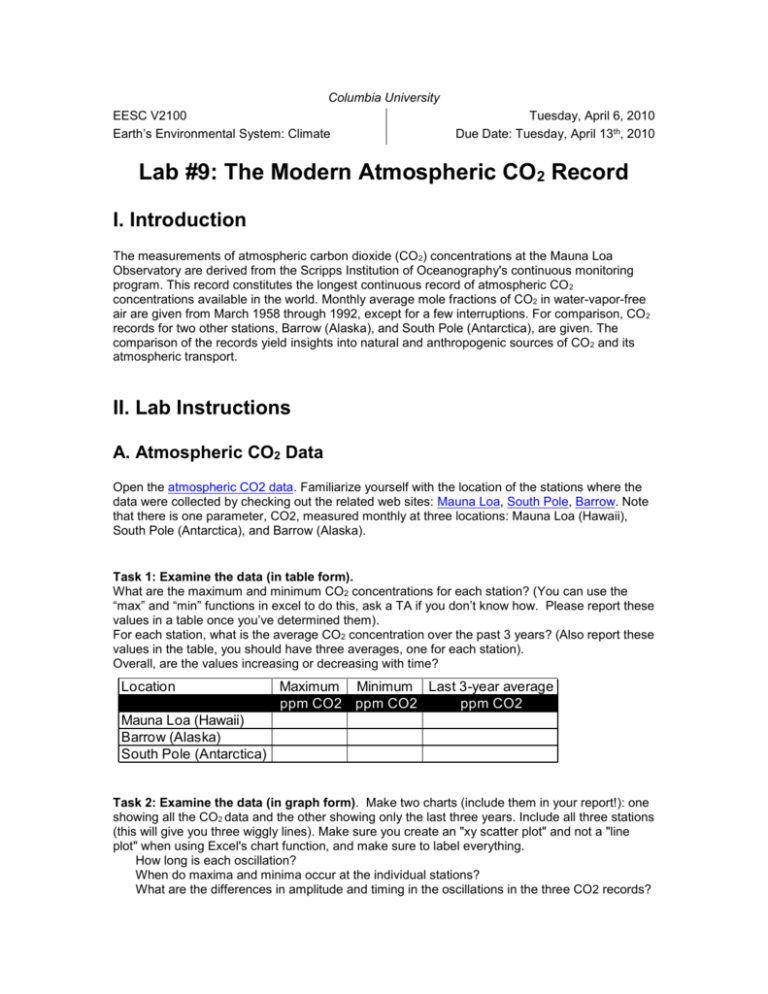
Columbia University EESC V2100 Earth’s Environmental System: Climate Tuesday, April 6, 2010 Due Date: Tuesday, April 13th, 2010 Lab #9: The Modern Atmospheric CO2 Record I. Introduction The measurements of atmospheric carbon dioxide (CO 2) concentrations at the Mauna Loa Observatory are derived from the Scripps Institution of Oceanography's continuous monitoring program. This record constitutes the longest continuous record of atmospheric CO 2 concentrations available in the world. Monthly average mole fractions of CO2 in water-vapor-free air are given from March 1958 through 1992, except for a few interruptions. For comparison, CO 2 records for two other stations, Barrow (Alaska), and South Pole (Antarctica), are given. The comparison of the records yield insights into natural and anthropogenic sources of CO 2 and its atmospheric transport. II. Lab Instructions A. Atmospheric CO2 Data Open the atmospheric CO2 data. Familiarize yourself with the location of the stations where the data were collected by checking out the related web sites: Mauna Loa, South Pole, Barrow. Note that there is one parameter, CO2, measured monthly at three locations: Mauna Loa (Hawaii), South Pole (Antarctica), and Barrow (Alaska). Task 1: Examine the data (in table form). What are the maximum and minimum CO2 concentrations for each station? (You can use the “max” and “min” functions in excel to do this, ask a TA if you don’t know how. Please report these values in a table once you’ve determined them). For each station, what is the average CO2 concentration over the past 3 years? (Also report these values in the table, you should have three averages, one for each station). Overall, are the values increasing or decreasing with time? Location Maximum Minimum Last 3-year average ppm CO2 ppm CO2 ppm CO2 Mauna Loa (Hawaii) Barrow (Alaska) South Pole (Antarctica) Task 2: Examine the data (in graph form). Make two charts (include them in your report!): one showing all the CO2 data and the other showing only the last three years. Include all three stations (this will give you three wiggly lines). Make sure you create an "xy scatter plot" and not a "line plot" when using Excel's chart function, and make sure to label everything. How long is each oscillation? When do maxima and minima occur at the individual stations? What are the differences in amplitude and timing in the oscillations in the three CO2 records? Task 3: Now view this animation showing monthly variations in net primary productivity (given in units of grams of carbon per square meter per month, or gC*m-2*month-1). What trends can you see through the year? When does overall NPP appear to be greatest, and least? Task 4: Go back to the graph showing the entire time series. Determine the long-term rate of change of the Mauna Loa CO2 concentrations by adding a trendline and displaying the equation of that line on the graph. What is the rate of change (including units)? Using the regression equation, extrapolate CO2 concentrations to the year 2100. How long will it take for CO 2 to rise another 150 ppm (50% of today’s concentration)? DISCUSSION (Part A): 1. What is causing the short-period (annual) oscillation of CO2? 2. Why do the CO2 patterns (the amplitudes and timing of oscillations) vary by location? In other words, why does the South Pole record look different from the Mauna Loa record? 3. What is responsible for the long-term change in CO2 concentrations measured at Mauna Loa? 4. In Task 4, you assumed that the rate of increase in CO 2 is constant. Is there evidence that the rate is actually systematically increasing or decreasing over the years? Can you explain this phenomenon? Based on the shape of the curves, do you think that you over- or underestimated the time it will take to exceed the latest measurement by 50%? B. Greenhouse Gases Task 5: Examine this table showing the concentrations, global warming potentials, and lifetimes for various greenhouse gases (GHGs). PLEASE NOTE: IN THE TABLE, NUMBERS DO NOT HAVE EXPONENTS, THOSE ARE ACTUALLY FOOTNOTES. Answer the following questions: Abundance: Rank the following GHGs in terms of increasing abundance: CO 2, CH4, SF6, CFC-12. The Global Warming Potential (GWP) is typically used to contrast different greenhouse gases relative to CO2. GWP is an index for estimating relative global warming. It is a measure of the warming contribution of a kg of a particular GHG as compared to the warming contribution of a kg of carbon dioxide. The GWP provides a simple measure of the relative radiative effects of the emissions of various greenhouse gases (see footnote 2 in the table for more information). Rank the following GHGs in terms of increasing GWP: CO2, CH4, SF6, CFC-12 Atmospheric lifetime (or “residence time”) is the time-scale characterizing the decay of an instantaneous pulse input into the reservoir (see footnote 3 on website). Rank the following GHGs in terms of increasing atmospheric residence time: CO2, CH4, SF6, CFC12. Task 6: Examine the projected concentrations of CO2 for the next century, given in the pdf document called “Lab 3 supplement” (From: "Climate Change 2007: The Physical Science Basis"). There’s a lot of info there, but focus on the CO 2 graphs. What is the minimum CO2 concentration projected for 2100? How does this compare with your projection for 2100 based on extrapolation of the Mauna Loa trend(s)? Task 7: HCFC-22 and HFC-23 were designated acceptable replacements for CFCs-11/12/113 in the initial Montreal Protocol because they have less potential to deplete stratospheric ozone than the CFCs. However, HCFC-22 and HFC-23 are greenhouse gases. Look at the metadata for HFC-23. What is the growth rate of HFC-23 in the atmosphere? Go back to the Current Greenhouse Gas chart. How does the present tropospheric concentration, GWP, and atmospheric lifetime of HCFC-22 compare to those of the CFCs (11/12/113)? DISCUSSION (Part B) 1. Why are we so concerned about atmospheric CO2, when its GWP is lower than other GHGs? 2. Why is there a wide range in emission scenarios? 3. Why do CO2 concentrations increase for all scenarios, even though emissions have decreased for some of them? 4. Why do CH4 concentrations show a decrease for some scenarios? What is the key difference between CO2 and CH4 that explains their different behavior here? (hint: think about residence times) 5. What are the major chemical differences between CFCs, HCFCs and HFCs? (see Kump Chapter 17, especially pages 357-359) Do you think using HCFCs and HFCs as substitutes for CFCs is a good idea? Why or why not? What are the environmental consequences of using HCFC-22 and/or HFC-23? EXTRA CREDIT (5 points): What processes remove CO2 and CH4 from the atmosphere? What controls these rates of removal? How might they have been different, say, during the last ice age? III. Lab Report Instructions Summarize your findings according to the format given in “Writing a Lab Report.” NOTE: Since there is no hands-on section, simply write a data section instead of procedures. It should cite what data you used and what variables were examined. All other sections should be included. V. Optional Reading List Carbon Dioxide Information Center (CDIAC) CDIAC publications and data Bacastow, R.B., C.D. Keeling, and T.P. Whorf. 1985. Seasonal amplitude increase in atmospheric CO2 concentration at Mauna Loa, Hawaii, 1959-1982. Journal of Geophysical Research 90(D6):10529-40. VI. Contributors Keeling, C.D., and T.P. Whorf. 1996. Atmospheric CO2 records from sites in the SIO air sampling network. In Trends: A Compendium of Data on Global Change. Carbon Dioxide Information Analysis Center, Oak Ridge National Laboratory, Oak Ridge, Tenn., U.S.A. Updated September 24, 2009 (K. Allen)


