Supply & Demand Poster Project Instructions
advertisement
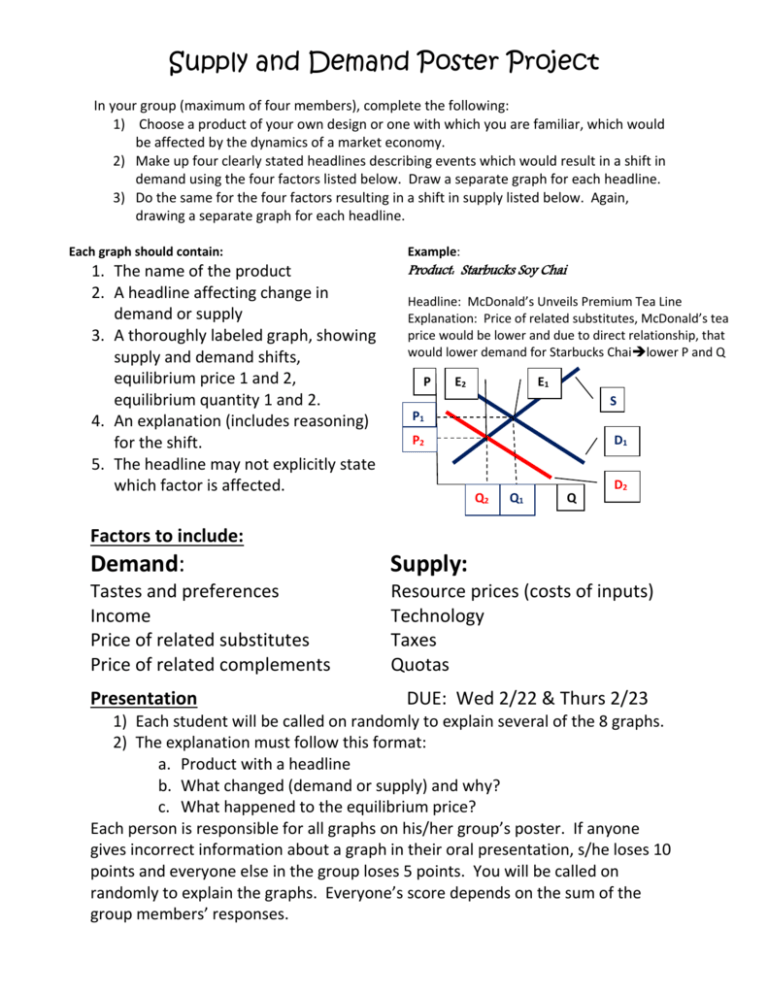
Supply and Demand Poster Project In your group (maximum of four members), complete the following: 1) Choose a product of your own design or one with which you are familiar, which would be affected by the dynamics of a market economy. 2) Make up four clearly stated headlines describing events which would result in a shift in demand using the four factors listed below. Draw a separate graph for each headline. 3) Do the same for the four factors resulting in a shift in supply listed below. Again, drawing a separate graph for each headline. Each graph should contain: 1. The name of the product 2. A headline affecting change in demand or supply 3. A thoroughly labeled graph, showing supply and demand shifts, equilibrium price 1 and 2, equilibrium quantity 1 and 2. 4. An explanation (includes reasoning) for the shift. 5. The headline may not explicitly state which factor is affected. Example: Product: Starbucks Soy Chai Headline: McDonald’s Unveils Premium Tea Line Explanation: Price of related substitutes, McDonald’s tea price would be lower and due to direct relationship, that would lower demand for Starbucks Chailower P and Q P E2 E1 S P1 P2 D1 Q2 Q1 Q D2 Factors to include: Demand: Supply: Tastes and preferences Income Price of related substitutes Price of related complements Resource prices (costs of inputs) Technology Taxes Quotas Presentation DUE: Wed 2/22 & Thurs 2/23 1) Each student will be called on randomly to explain several of the 8 graphs. 2) The explanation must follow this format: a. Product with a headline b. What changed (demand or supply) and why? c. What happened to the equilibrium price? Each person is responsible for all graphs on his/her group’s poster. If anyone gives incorrect information about a graph in their oral presentation, s/he loses 10 points and everyone else in the group loses 5 points. You will be called on randomly to explain the graphs. Everyone’s score depends on the sum of the group members’ responses.
![[Type text] Fill in a fictional “headline from the future” above](http://s3.studylib.net/store/data/008674091_1-c12eeba0d4bd6938777e08ea064ad30a-300x300.png)
