KNO3 Solubility Lab: Temperature & Saturation
advertisement
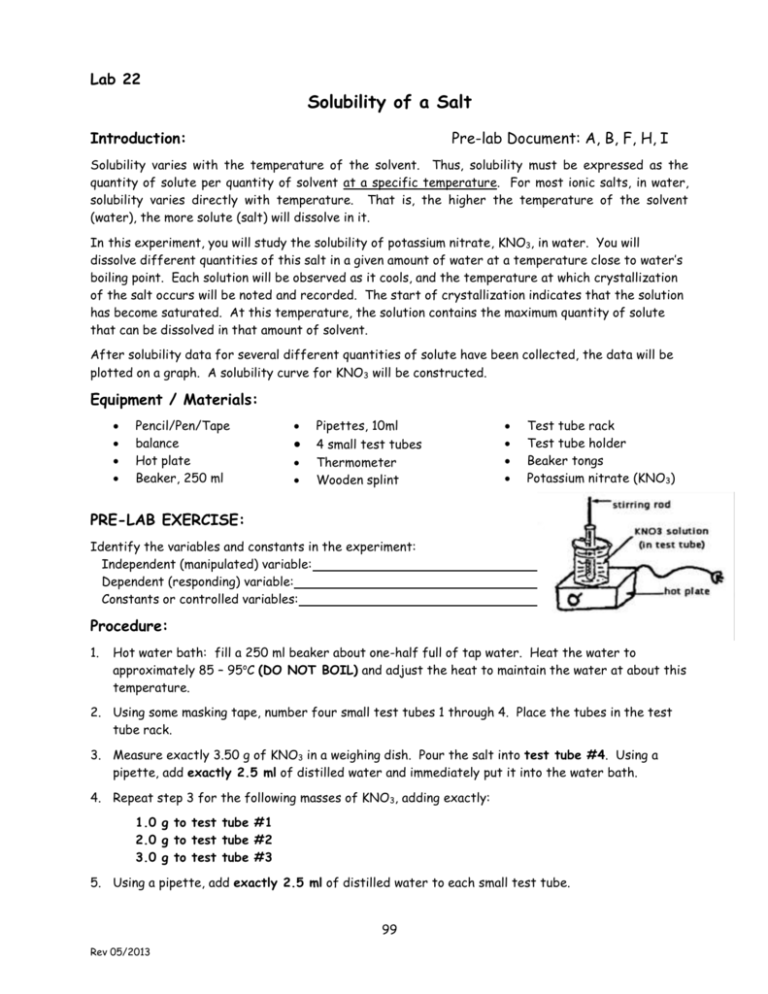
Lab 22 Solubility of a Salt Introduction: Pre-lab Document: A, B, F, H, I Solubility varies with the temperature of the solvent. Thus, solubility must be expressed as the quantity of solute per quantity of solvent at a specific temperature. For most ionic salts, in water, solubility varies directly with temperature. That is, the higher the temperature of the solvent (water), the more solute (salt) will dissolve in it. In this experiment, you will study the solubility of potassium nitrate, KNO3, in water. You will dissolve different quantities of this salt in a given amount of water at a temperature close to water’s boiling point. Each solution will be observed as it cools, and the temperature at which crystallization of the salt occurs will be noted and recorded. The start of crystallization indicates that the solution has become saturated. At this temperature, the solution contains the maximum quantity of solute that can be dissolved in that amount of solvent. After solubility data for several different quantities of solute have been collected, the data will be plotted on a graph. A solubility curve for KNO3 will be constructed. Equipment / Materials: Pencil/Pen/Tape balance Hot plate Beaker, 250 ml Pipettes, 10ml 4 small test tubes Thermometer Wooden splint Test tube rack Test tube holder Beaker tongs Potassium nitrate (KNO3) PRE-LAB EXERCISE: Identify the variables and constants in the experiment: Independent (manipulated) variable: Dependent (responding) variable: Constants or controlled variables: Procedure: 1. Hot water bath: fill a 250 ml beaker about one-half full of tap water. Heat the water to approximately 85 – 95oC (DO NOT BOIL) and adjust the heat to maintain the water at about this temperature. 2. Using some masking tape, number four small test tubes 1 through 4. Place the tubes in the test tube rack. 3. Measure exactly 3.50 g of KNO3 in a weighing dish. Pour the salt into test tube #4. Using a pipette, add exactly 2.5 ml of distilled water and immediately put it into the water bath. 4. Repeat step 3 for the following masses of KNO3, adding exactly: 1.0 g to test tube #1 2.0 g to test tube #2 3.0 g to test tube #3 5. Using a pipette, add exactly 2.5 ml of distilled water to each small test tube. 99 Rev 05/2013 6. Put all 4 test tubes in the hot water bath. Gently stir the KNO3 – water mixture in each tube with a wooden splint until the KNO3 is completely dissolved. Be careful! Once all the solids have dissolved in all test tubes, remove test tube #4 from the hot water bath and place it in the test tube rack. 7. To avoid premature crystallization, warm the thermometer in the hot water bath first, and then place it into the solution in the test tube rack. Beginning with test tube #4, look for the first sign of crystallization. At the instant crystallization starts, record the temperature to the nearest 0.1 oC. Should crystallization start too quickly, redissolve the solid in the hot water bath and repeat this step. 8. Repeat step #7 and record the temperature of crystallization for each test tube. Work backwards, going on to test tube #3 next, then #2 and finally #1. If necessary, TEST TUBE #1 ONLY, can be immersed in a room temperature water bath. Clean Up: Re-heat the test tubes to dissolve all crystals and then pour the warm solutions into the waste beaker. Thoroughly clean/rinse the test tubes and leave them up-side-down in the test tube rack. Data: Create a data table similar to the one below in your pre-lab. Be certain to include units in the column headings and the title. KNO3 Crystallization Temperatures and Calculations Test Tube g KNO3 / 2.5 ml g KNO3 / 100 ml Experimental Crystallization Temp oC Theoretical Crystallization Temp oC (Table D) 1 2 3 4 Data Analysis: 1. Set up a graph of mass of KNO3 / 100 ml of water (y-axis) versus temperature (x-axis). The graph should have the appropriate heading, labels for axes and scale. Plot your experimental data on a graph. Plot mass of KNO3 per 100 ml verses crystallization temperature. 2. Using a different colored pencil, plot the theoretical data on the same graph. Plot mass of KNO3 per 100 ml versus crystallization temperature using the values from table D. Summary Questions: Answer the following questions in complete sentences in your final lab report. 1. Describe the relationship between temperature of a solvent and the amount of solid solute that is required to make a saturated solution. 2. What do the downward sloping lines on Table D indicate about the relationship between the temperature of the solvent and the amount of solute for some substances like sulfur dioxide (note that SO2, HCl, and NH3 are gases under normal conditions)? 3. Why do some substances have lower solubilities at higher solvent temperatures? 100 Rev 05/2013
