A Brief Statistical Analysis of Accident/Incident Rates at Jefferson Lab
advertisement
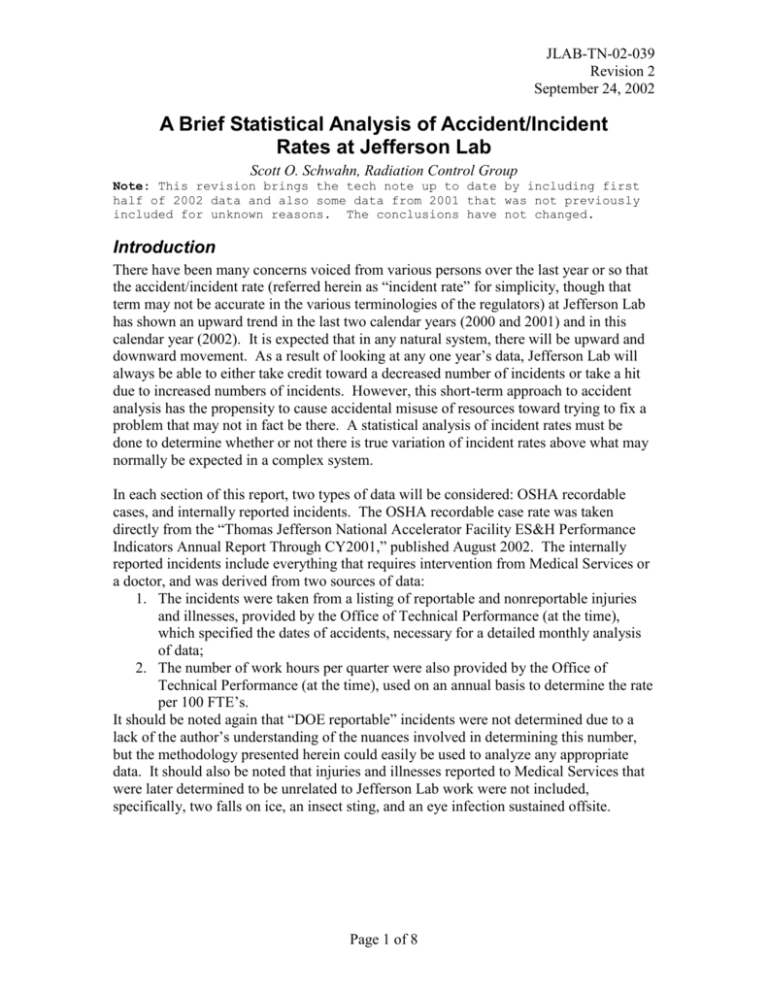
JLAB-TN-02-039 Revision 2 September 24, 2002 A Brief Statistical Analysis of Accident/Incident Rates at Jefferson Lab Scott O. Schwahn, Radiation Control Group Note: This revision brings the tech note up to date by including first half of 2002 data and also some data from 2001 that was not previously included for unknown reasons. The conclusions have not changed. Introduction There have been many concerns voiced from various persons over the last year or so that the accident/incident rate (referred herein as “incident rate” for simplicity, though that term may not be accurate in the various terminologies of the regulators) at Jefferson Lab has shown an upward trend in the last two calendar years (2000 and 2001) and in this calendar year (2002). It is expected that in any natural system, there will be upward and downward movement. As a result of looking at any one year’s data, Jefferson Lab will always be able to either take credit toward a decreased number of incidents or take a hit due to increased numbers of incidents. However, this short-term approach to accident analysis has the propensity to cause accidental misuse of resources toward trying to fix a problem that may not in fact be there. A statistical analysis of incident rates must be done to determine whether or not there is true variation of incident rates above what may normally be expected in a complex system. In each section of this report, two types of data will be considered: OSHA recordable cases, and internally reported incidents. The OSHA recordable case rate was taken directly from the “Thomas Jefferson National Accelerator Facility ES&H Performance Indicators Annual Report Through CY2001,” published August 2002. The internally reported incidents include everything that requires intervention from Medical Services or a doctor, and was derived from two sources of data: 1. The incidents were taken from a listing of reportable and nonreportable injuries and illnesses, provided by the Office of Technical Performance (at the time), which specified the dates of accidents, necessary for a detailed monthly analysis of data; 2. The number of work hours per quarter were also provided by the Office of Technical Performance (at the time), used on an annual basis to determine the rate per 100 FTE’s. It should be noted again that “DOE reportable” incidents were not determined due to a lack of the author’s understanding of the nuances involved in determining this number, but the methodology presented herein could easily be used to analyze any appropriate data. It should also be noted that injuries and illnesses reported to Medical Services that were later determined to be unrelated to Jefferson Lab work were not included, specifically, two falls on ice, an insect sting, and an eye infection sustained offsite. Page 1 of 8 JLAB-TN-02-039 Revision 2 September 24, 2002 Method There are several methods for analyzing data from a natural complex process. An accepted method for analysis is called Statistical Process Control (SPC), or XmR analysis1,2. This analysis looks at the average incident rate in an arbitrary time period and the variation from year to year to determine whether or not any individual year or set of years fall outside a natural process limit. First, the average incident rate must be determined. The selection of years from which to determine this average affects the results, but not strongly. A reasonable selection of calendar years to select the data is the period from 1997-2001. Prior to those dates, incident rates were very obviously higher, and likely dropped due to the change in scope of Jefferson Lab activities from a construction to post-construction mission. After the average incidence rate has been determined, the “moving range” values must be determined. These are simply the absolute value of the differences between successive years’ incident rates. From these moving range values, an average moving range value may then be determined. This average moving range value is the figure that sets the natural process limits for deciding whether or not an individual year’s data is normal or not. Table 1 – OSHA Recordable Cases per 100 FTE Year 1997 1998 1999 2000 2001 Average (1997-2001) X 3.3 2.9 1.5 1.8 2.6 mR 0.4 1.4 0.3 0.8 2.42 0.73 Table 2 – Internally reported incidents per 100 FTE Year 1993 1994 1995 1996 1997 1998 1999 2000 2001 2002 (to date) Average (1997-2001) X mR 7.6 6.2 1.3 4.3 1.9 4.5 0.2 4.1 0.3 3.4 0.8 1.7 1.6 2.2 0.5 2.5 0.3 3.4 0.9 2.43 0.81 Page 2 of 8 JLAB-TN-02-039 Revision 2 September 24, 2002 The Upper Range Limit (URL) may then be calculated for the moving ranges, which is the highest level one should expect for a year-to-year variation in incident rate. It uses a simple scaling factor of 3.27i. Therefore, both the OSHA recordable and Jefferson Lab internal Upper Range Limits are: URL 3.27 x mR 3.27 x 0.73 2.39 This number indicates that unless there is a change greater than 2.39 cases per 100 FTE’s from one year to the next, the variation is probably normal. Next, the Upper Natural Process Limit (UNPL) and Lower Natural Process Limit (LNPL) should be determined. These limits describe the natural range of variation for the data in any single year. The scaling factor for these limits is 2.66i. The UNPLs are calculated in a similar fashion: UNPLOSHA X (2.66 x mR) 2.42 (2.66 x 0.73) 4.35 LNPLOSHA X (2.66 x mR) 2.42 (2.66 x 0.73) 0.49 UNPLINT X (2.66 x mR) 2.43 (2.66 x 0.81) 4.58 LNPLINT X (2.66 x mR) 2.43 (2.66 x 0.81) 0.29 i These natural process control limits are those that are commonly used in control charts. The underlying assumption is that the Central Limit Theorem is applicable and that the process may be described adequately by a Normal distribution. Page 3 of 8 JLAB-TN-02-039 Revision 2 September 24, 2002 From these data, charts may be created which give better visualization: X- OSHA Recordable incidents per 100 FTE 5.00 4.00 UNPL 3.00 Incidents Average 1997-2001 2.00 LNPL 1.00 0.00 1997 1998 1999 2000 2001 CY OSHA Recordable moving range (mR) moving ranges (mR) 2.50 2.00 URL 1.50 mR 1.00 AVG mR 0.50 0.00 1997 1998 1999 CY Page 4 of 8 2000 2001 JLAB-TN-02-039 Revision 2 September 24, 2002 Internally reported 8.00 incidents per 100 FTE 7.00 6.00 UNPL 5.00 Incidents 4.00 Average 1997-2001 3.00 LNPL 2.00 1.00 0.00 1993 1994 1995 1996 1997 1998 1999 2000 2001 2002 CY internally reported moving range (mR) 3.00 moving ranges (mR) 2.50 2.00 URL 1.50 mR AVG mR 1.00 0.50 0.00 1993 1994 1995 1996 1997 1998 1999 2000 2001 2002 CY Sensitivity Analysis As mentioned previously, the selection of years that one chooses to call “normal” can be somewhat arbitrary. However, the above analyses were repeated for various changes that were reasonable – for instance, selecting the following time periods to call “normal”: 1997-1999, 1998-2000, and 1998-2001. Regardless of what one considers normal, the last two calendar years do not represent actual systematic increases. In fact, an analysis of the data for 1997-2001 data shows that we can only consider 2001 to be “higher than Page 5 of 8 JLAB-TN-02-039 Revision 2 September 24, 2002 normal” if we are willing to state that we are only 60% certain of that being the case. But then we would have to state that 1997 and 1998 were higher than normal as well, which does not make a great deal of sense – three of five of the defining “normal” years being abnormally high. There are some systematic approaches to defining the time period for normality, but it is an easy and conservative approach to simply select years with the lowest incident rates. An Alternate Viewpoint Recognizing that it is somewhat useless to try and catch a trend in the years after the trend has started, one may wish to look at the data on a more reasonable basis, perhaps on a monthly basis, to determine whether or not there has been a more recent relaxation of safety. The same method may be used, and the data are presented on the following two pages. Another helpful control chart feature that may be employed is the use of “1sigma” and “2-sigma” lines. These lines allow the observer to tell if in fact a trend is happening, perhaps a bit sooner than a completely retrospective analysis. Common use of these lines is as followsii: One point beyond the 3-sigma limitsiii Two out of three consecutive points beyond the 2-sigma limit Four out of five consecutive points beyond the 1-sigma limit Eight consecutive points on either side of the line. It is clear that none of these conditions has been met in any month since July 1997. ii From the Montgomery book cited in the endnotes, page 767. The actual rules were first suggested in the Western Electric Handbook (1956) and are in common use iii A more conservative limit used in this paper is the 2.67 sigma limit Page 6 of 8 JLAB-TN-02-039 Revision 2 September 24, 2002 12.000 11.000 10.000 9.000 8.000 7.000 6.000 5.000 4.000 3.000 2.000 1.000 0.000 -1.000 -2.000 UNPL 2-sigma 1-sigma Incidents Average 1997-2001 LNPL J-93 A-93 J-93 O-93 J-94 A-94 J-94 O-94 J-95 A-95 J-95 O-95 J-96 A-96 J-96 O-96 J-97 A-97 J-97 O-97 J-98 A-98 J-98 O-98 J-99 A-99 J-99 O-99 J-00 A-00 J-00 O-00 J-01 A-01 J-01 O-01 J-02 A-02 incidents per month Internally reported Month Page 7 of 8 JLAB-TN-02-039 Revision 2 September 24, 2002 Conclusions Two main conclusions may be drawn from the analysis: 1. There have been no real increases or decreases in the number of incidents at Jefferson Lab over the last five years. 2. There have been no individual years in the last five years with statistically significant changes from the previous year. It is apparent, however, that there was a major change in safety culture or a change in scope of work in the mid-1990’s that contributed to a re-baselining of what Jefferson Lab should consider a “normal” incident rate. Looking at one year of data and comparing it to the previous year of data without considering overall performance record results in a binary world view – one is always either "operating okay" or else "in trouble." Doing so does not take into account that a given system has natural variation, and there are always going to be years that are worse than the year before, and even two or three years running that also seem like a trend. It is counterproductive to dedicate resources to respond to data that only appear at first glance to show degradation in quality. A systematic approach should be taken before reacting to any individual year of data. With all of this in mind, however, a few disclaimers should be noted: 1. It is recognized and correct that no accidents are acceptable, regardless of whether they are statistically significant or not. Every single one should be investigated and it should be determined what could be done better to prevent it in the future. 2. This technique, as presented, is an indicator about whether safety at the Lab as a whole has suffered erosion, and does not indicate whether or not specific areas of safety have broken down. It needs to be refined toward suspect areas to make that determination. 3. This technique breaks down for individual types of accidents, e.g., hand lacerations, due to the infrequency of the event. To monitor individual types of accidents, if infrequent, the data needs to be massaged first. For instance, analyzing for hand lacerations may better be done by monitoring the frequency of the event (i.e., instantaneous calculation of rate of lacerations per year, determined from one laceration event to the next). This technique works well for making an immediate estimate (right at the time of an individual event) of whether or not an unusual number of "infrequent" accidents are occurring. A systematic approach such as the one presented may be used to effectively differentiate an actual “signal” from increased accident rates from “noise” due to natural fluctuations. The careful use of this data will allow management to assess safety programs effectively and react to real, not perceived, changes in the safety culture at the lab. 1 Wheeler, Donald J., Understanding Variation, SPC Press, Knoxville, TN, 2000. 2 Montgomery, Douglas C. and Runger, George C., Applied Statistics and Probability for Engineers, John Wiley and Sons, Inc., New York, 1999. Page 8 of 8
