HG Teacher 2014.doc - St. Paul Public Schools
advertisement
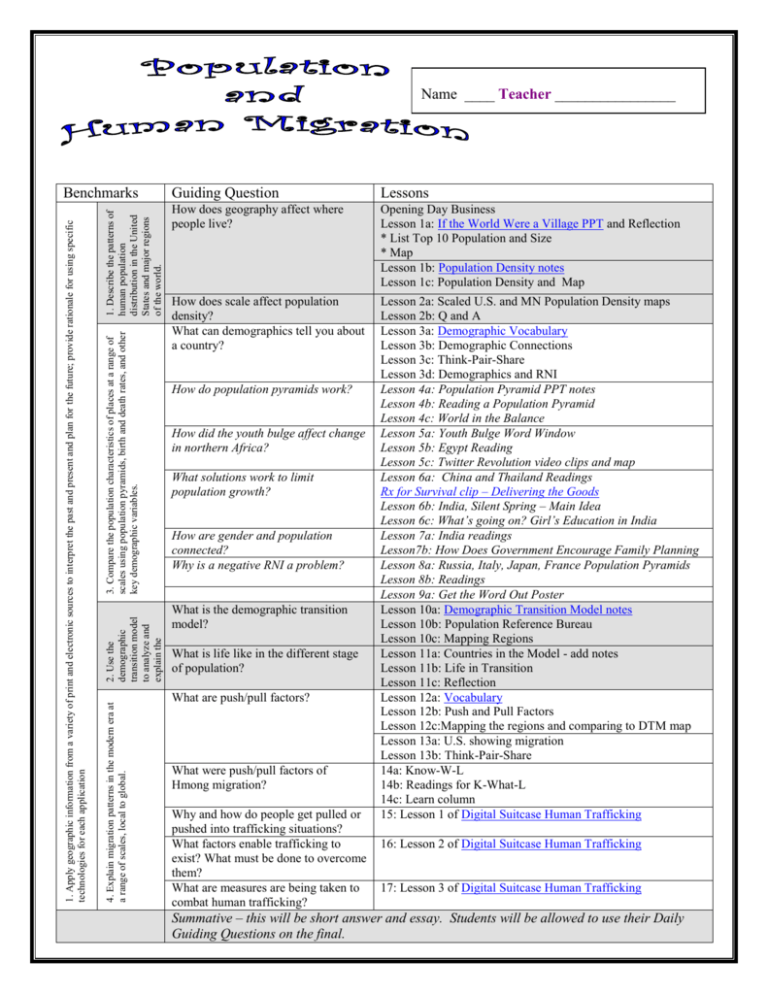
Name ____ Teacher ________________ 1. Describe the patterns of human population distribution in the United States and major regions of the world. 3. Compare the population characteristics of places at a range of scales using population pyramids, birth and death rates, and other key demographic variables. Guiding Question Lessons How does geography affect where people live? Opening Day Business Lesson 1a: If the World Were a Village PPT and Reflection * List Top 10 Population and Size * Map Lesson 1b: Population Density notes Lesson 1c: Population Density and Map How does scale affect population density? What can demographics tell you about a country? Lesson 2a: Scaled U.S. and MN Population Density maps Lesson 2b: Q and A Lesson 3a: Demographic Vocabulary Lesson 3b: Demographic Connections Lesson 3c: Think-Pair-Share Lesson 3d: Demographics and RNI Lesson 4a: Population Pyramid PPT notes Lesson 4b: Reading a Population Pyramid Lesson 4c: World in the Balance Lesson 5a: Youth Bulge Word Window Lesson 5b: Egypt Reading Lesson 5c: Twitter Revolution video clips and map Lesson 6a: China and Thailand Readings Rx for Survival clip – Delivering the Goods Lesson 6b: India, Silent Spring – Main Idea Lesson 6c: What’s going on? Girl’s Education in India Lesson 7a: India readings Lesson7b: How Does Government Encourage Family Planning Lesson 8a: Russia, Italy, Japan, France Population Pyramids Lesson 8b: Readings Lesson 9a: Get the Word Out Poster Lesson 10a: Demographic Transition Model notes Lesson 10b: Population Reference Bureau Lesson 10c: Mapping Regions Lesson 11a: Countries in the Model - add notes Lesson 11b: Life in Transition Lesson 11c: Reflection Lesson 12a: Vocabulary Lesson 12b: Push and Pull Factors Lesson 12c:Mapping the regions and comparing to DTM map Lesson 13a: U.S. showing migration Lesson 13b: Think-Pair-Share 14a: Know-W-L 14b: Readings for K-What-L 14c: Learn column 15: Lesson 1 of Digital Suitcase Human Trafficking How do population pyramids work? How did the youth bulge affect change in northern Africa? What solutions work to limit population growth? How are gender and population connected? Why is a negative RNI a problem? 2. Use the demographic transition model to analyze and explain the impact of changing birth and death rates in major world regions. What is the demographic transition model? What is life like in the different stage of population? 4. Explain migration patterns in the modern era at a range of scales, local to global. 1. Apply geographic information from a variety of print and electronic sources to interpret the past and present and plan for the future; provide rationale for using specific technologies for each application Benchmarks What are push/pull factors? What were push/pull factors of Hmong migration? Why and how do people get pulled or pushed into trafficking situations? What factors enable trafficking to exist? What must be done to overcome them? What are measures are being taken to combat human trafficking? 16: Lesson 2 of Digital Suitcase Human Trafficking 17: Lesson 3 of Digital Suitcase Human Trafficking Summative – this will be short answer and essay. Students will be allowed to use their Daily Guiding Questions on the final. Lesson 1a: If the World Were a Village 7 billion is a lot of people, but many of these 7 billion have a lot in common like religion, language and lifestyle. What if we took what the 7 billion had in common and reduced it to a village of 100 to reflect religion, language and lifestyle? What do you think this village of 100 would look like? Read each statement below and write what you think is the best answer in the Before column. The ratios for resources have also been reduced. Before 1. _____________ is the continent with the most people. a. Europe b. North America c. Asia d. Africa 2. Do you think there would are more males or females in the world village? a. males b. females c. they are exactly equal 3. How many do you think would speak Mandarin Chinese in the world village? a. 6 b. 8 c. 12 d. 14 4. How many people in the world village are Christian? a. 25 b. 33 c. 50 d. 60 5. Which age group in the world village has the most people? a. 0 – 15 yrs b. 16 – 30 yrs c. 31 – 45 yrs d. 46 – 60 yrs 6. How many people in the village of 100 live in an adequate home? a. 20 b. 35 c.50 d. 65 7. How many people in the world village of 100 are able to read and write? a. 17 b. 33 c. 41 d. 84 8. How many people in the world village of 100 have enough food? a. 10 b. 33 c. 67 d. 82 9. How many people in the world village of 100 have access to clean water? a. 57 b. 67 c. 77 d. 87 10. How many people in the world village of 100 have access to running water (they don’t have to walk to a well or water source)? a. 61 b. 71 c. 81 d. 91 11. How many people in the world village of 100 have electricity? a. 56 b. 66 c. 76 d. 86 12. Would the people in the world village of 100 have more a. radios b. TVs c. telephones d. computers 13. How many people in the village of 100 would have a college education? a. 1 b. 10 c. 50 d. 75 14. How many people in the world village live on less than $2.00 a day? a. 53 b. 63 c. 73 d. 83 After c. Asia a. males d. 14 b. 33 a. 0-15 yrs d. 65 d. 84 c. 67 b. 67 a. 61 c. 76 a. radios b. 10 a. 53 Reflection Look back at Lesson 1a above and compare/contrast your Before answers to the After answers. How does your impression of what is going on with the world’s population compare/contrast with the statistics? If you feel there is not enough room for an adequate student response, have students write their response on a note card. 2 List: Where Is the World’s Population and Land? Largest Countries in Land Size Largest Population Countries 1. Russia 1. China 2. China 2. India 3. United States 3. United States 4. Canada 4. Indonesia 5. Brazil 5. Brazil 6. Australia 6. Pakistan 7. India 7. Bangladesh 8. Argentina 8. Nigeria 9. Kazakhstan 9. Russia 10. Algeria 10. Japan 3 Mapping the 10 Largest Land Size Countries and 10 Largest Population Countries Label the countries from the lists on page 3 4 Lesson 1b: Population Density notes Population Density: the number of people living per unit of an area (e.g. per square mile); divide the amount of land by the number of people Geographic features that affect population: * too hot - desert * too cold * too wet * too dry Lesson 1c: Population Density and Maps World Maps A and B. Physical and Climate Maps will help answer questions 6 - 8 1. According to map A, what is the population density of the U.S. per square mile? 25-49 2. According to map B, what is the population density of the U.S. per square mile? below 3 – over 520 3. According to map A, which two continents have the highest population density? Europe and Asia 4. Does map B show these same two continents as having high population density? Yes 5. Look at map B. Look at regions that have very thin strips of population density (northern Africa, eastern Australia, western United States, Egypt and Sudan). What do these regions of high population density have in common geographically? Along water 6. What geographic feature keeps population low in Canada and northern Russia? cold 7. What geographic feature keeps population low in northern Africa and central Australia? Desert 8. What geographic feature keeps population low in western South America? Mountains China – Map C. Physical and Climate maps will help answer questions 13 - 14 9. Is map C’s scale smaller or larger than maps A and B? smaller 10. According to map A, what is China’s population density per square mile? 100 – 149 11. According to map C, which region of China has the highest population density? Eastern 12. Shanghai, Tianjin, Macao and Hong Kong have very high population densities. Which geographic feature do they have in common? East China Sea or Water 13. What geographic feature keeps population low in Qinghai province? Desert or Gobi desert 14. What geographic feature keeps population low in Tibet province? Mountains or Himalayas Lesson 2a: Scaled U.S. and MN Population Density Maps outline Minneapolis, St. Paul and districts with numbers U.S. Population Density Map MN Congressional Districts Map People per Square Mile 0 - 50 51 - 300 301 – 1,000 1,001 – 2,000 2,001 – 4,000 4,001 – Twin Cities Metropolitan Area Map People per Square Mile 0 - 500 People per Square Mile 0 - 50 501 – 1,000 51 - 100 1,001 – 2,000 101 - 200 2,001 – 4,000 201 - 400 4,001 – 7,000 401 – 1,000 Human Geography Summer Session 2014 6 5,000 over 1,000 Human Geography Summer Session 2014 7 Lesson 2b: Q and A U.S. Population Density Map 1. What happens to land area of states as you move east to west in the United States? Gets larger 2. Does this tend to create a larger or smaller population density? smaller 3. Which of the five themes of geography describes this map? region 4. Overall, which region has the most states with the highest population densities? Northeast 5. Overall, which region has the most states with very low population densities? Rocky Mt. 6. Which two regions have very similar population densities? Midwest, South 7. Which region has a higher population density, Midwest or Great Plains? Midwest 8. Which has a greater population density, the west coast or the east coast? East coast Minnesota Congressional Districts Map 9. Is the scale of this map larger or smaller than the U.S. Population Density Map? Smaller 10. According to the U.S. map, what is the population density of MN per square mile? 51 – 100 11. According to the MN Congressional District map, is this true for the whole state? no 12. Are congressional districts based on equal land size or equal population? Equal population 13. What happens to population density as you move closer to Minneapolis and St. Paul? higher Twin Cities Metropolitan Area Map 14. Is the scale of this map larger or smaller than the MN Congressional District Map? Smaller 15. Which region of Dakota County probably has the most people? Northern 16. Why does this region of Dakota County probably have the most people? Closer to the cities 17. Which part of Hennepin County has the highest population density? Minneapolis Lesson 3a: Demographic Vocabulary * Demographics: statistics relating to population or certain groups * Total Fertility Rate The average number of children that would be born alive to a woman in her lifetime * Infant Mortality Rate# deaths to infants under one year of age per 1,000 births in a given year * Literacy: ability to read and write * Death Rate: # of deaths per 1000 population in a given year * Birth Rate: The number of live births per 1,000 in a given year. * Rate of Natural Increase - RNI rate population is increasing /decreasing in a year based on birth rate and death * Replacement-Level Fertility: The level of fertility at which a couple has only enough children to replace themselves, or about two children per couple. Human Geography Summer Session 2014 8 Lesson 3b: Demographic Connections https://www.cia.gov/library/publications/the-world-factbook/ Country Current Population Infant Mortality/ Literacy: Male/Female 1000 live births Lesson 3d: Demographics and Rate of Natural Increase (Population Growth Rate) Total Fertility Rate A. Birth Rate/1000 A. Death Rate/1000 B. Rate of Natural Increase % C. Doubling Time at Current RNI Years Bangladesh 161 million 549 61 52 2.5 23 6 1.7% 41-42 years Brazil 199.3 million 21 88 89 1.82 15 7 .8% 87-88 years China 1. 34 billion 16 96 86 1.79 12 7 .5% 140 years India 1.2 billion 46 73 48 2.6 21 7 1.4% 50 years Indonesia 248.6 million 27 94 87 2.23 18 6 1.2% 58-59 years Japan 127 million 2.2 99 99 1.4 8 9 -.1% Nigeria 170 million 74 72 50 5.38 39 14 2.5% 28 years Pakistan 190 million 61 68 40 3 24 7 1.7% 41-42 years Russia 142.5 million 7.3 99 99 1.6 12 14 -.2% United States 313.8 million 6 99 99 2 14 8 .6% World 7,021,836,029 Population will be cut in half in this many years 700 years Population will be cut in half in this many years 350 years 116-117 years 19 births 8 deaths Coding * color the three highest numbers in each column with one color * color the three lowest numbers in each column with another color Lesson 3d B.) Rate of Natural Increase (in percent) 1. Birth Rate – Death Rate = B 2. B/10 = RNI C.) Population Doubling Time 70/RNI = doubling time (round up) Human Geography Summer Session 2014 9 Lesson 4a: Population Pyramid PowerPoint Slide Notes 1 What are Population Pyramids? bar graphs that show the percent or number of age and gender in a population 2 Two Types of Populations Old Populations Less than 25% under 15 More than 10% over 65 3 4 Young Populations More than 25% under 15 Less than 5% of 65 Dependency Ratio What is it? The number of people that are too young or too old to work, compared to the number of people in their productive years. What are the uses of Population Pyramids? Can determine Future Growth or decline Marketing groups Housing Politics Education Labor Crime Pyramid Shapes * growing * stable/slow growth * negative * dependency ratio a lot of kids * 2 children * a lot of elderly Human Geography Summer Session 2014 13 Lesson 4b: Reading a Population Pyramid Examine the population pyramids and decide if the population is Growing (G), Slow Growth (SG) Stable (S) or Negative (N) Growing, Bangladesh Brazil China India Indonesia Japan Nigeria Pakistan Russia U.S 1. Growing 2. SG 3. SG 4. G 5. grow 6. N 7. G 8. G 9. N 10. S or Slow Growth/Sta ble or Negative Growth 11. Which three countries’ population is growing the fastest? __India, Nigeria, Pakistan ______________ 12. Based on these population pyramids, what is at least one thing countries in #11 need to do to prepare for the future? ___ jobs for young people, schools ____________________________________________ 13. Which country has more females ages 65-69 than females 0-4? __ Russia ______________________ 14. Why would this be a problem (#13)? ___not enough young to replace the old ___________________ Look at the at the bar for 0-4 years and estimate the number of males and females in the age group. Bangladesh Brazil China India Indonesia Japan Nigeria Pakistan Russia U.S. Males 9m 7.8m 43m 63m 11.5m 2.9m 14.9m 11m 4.5m 10.25 0-4 Females 8.8 m 7.4m 37m 54m 10.9m 2.7m 14.5m 10.5m 4.2m 9.75 0-4 15. Are there usually more boys or more girls born? ___ boys ___________________________________ 16. Which two countries have abnormally more boys than girls born? ___China, India _______________ 17. What is at least one potential problem these countries could have in the future? __ not enough women _____________________________________________________________________________________ Human Geography Summer Session 2014 14 Lesson 4b: World in the Balance India 1. Which country will surpass China as the most populated country? 18. How is Japan’s population pyramid different from India’s? negative 19. What will Japan not have enough of to support its economy? workers India 2. Whose lives must improve if India wants to change its PGR? women 3. Why did the mother-in-law and husband not allow the woman to be sterilized? Wanted another son 4. Why are sons preferred in India? Take care of parents, carry on family name 5. What is the advice to the family to help their son survive to adulthood? Health care, vaccines 6. What kind of information does Manisha Gupta arrange for young couples to hear about? Birth control 7. What is one reason a daughter-in-law will be burned or maimed by her in-laws or husband? Not having a son 8. Why are there 35 million fewer women in India than there should be? Sex selective abortion, infanticide 9. According to Abidi Shaw, what is her answer to women’s situation? Kenya 20. What is one of the fastest growing regions? Sub-Saharan Africa 21. What is disappearing fast in Africa? 22. How was Kenya able to cut its fertility rate in half? Birth control 23. What stage do countries want to move through quickly? Stage 2 24. What is causing the death rate to increase? AIDS 25. What does Florence do to make money? prostitution 26. Who is disappearing in Kenya’s population pyramid? Working age adults 27. If fewer children are born, where can countries put its resources? The economy, schools, jobs 28. What is the key to population control? 10. What is the ideal family size? 2 children Japan 11. What is happening at the school in Oguchi, Japan? No children 12. What will happen to Japan’s population by the end of this century? Cut in half 13. Who is blamed for the declining birth rates in Japan? Women, singles 14. Why are more Japanese women working? Keep up middle class lifestyle 15. What was Tomoko’s challenge when she went back to work? Day care 16. By 2050 how many Japanese will be over 65? 17. In Japan, who is responsible for taking care of the elderly? women Human Geography Summer Session 2014 15 Lesson 5a: Youth Bulge Word Window Use the population pyramids of Egypt, Tunisia and Libya to create a word window for ‘Youth Bulge’ Definition Characteristics Sketch Youth Bulge Examples Lesson 5b: Dreams Stifled Egyptian Reading 1. What kept Mr. Sayyid from getting married? 12. What doesn’t the Egyptian education system do? Couldn’t save enough money for an apartment and furniture Work in modern world 2. Why is marriage so important? 13. What does the Egyptian economy not provide? Gateway to independence, sexual activity and social respect Enough well paying jobs 3. What are young Egyptians turning to for solace? 14. What did young people in rural Egypt hope would bring them out of poverty? religion education 4. What is becoming the cornerstone of identity for young, frustrated Egyptians? 15. Why are many graduates not able to get private sector jobs? Islam Not qualified 5. Why do countries like Egypt and Saudi Arabia help finance mass weddings? 16. Why do unemployed college graduates not take factory jobs? So many young unmarried people is de-stabilizing Blow to family honor 6. In the Middle East, why is marriage so important? Key to adulthood, religious obligation 17. What is an abaya? Loose black gown 7. How do many parents spend their savings? 18. Why did her fiancé’s family have no money for a wedding? On their children’s weddings 8. If marriage is so important, why aren’t couples getting married? Had to pay for two older sons’ marriages To expensive 19. What did she turn to when her engagement ended? Became religious 9. How long would it take a poor father and his son to save enough money for a wedding? 20. How long did it take Walid Faragallah to find a factory job? 8 years 6 years 10. What is happening to the marriage age in the Middle East? 21. How much does his current salary job pay a month? Delayed marriage $108 11. What did Mr. Sayyid attend school for? Tourism, hotel operation Human Geography Summer Session 2014 23. What advice does Walid have for his friends at university? Not to dream too much 9 Lesson 5c: Revolutions and the Youth Bulge The video clips are easier to play in Firefox than other browsers How did young people, their concerns and knowledge contribute to their 2011 Revolutions? Tunisia http://abcnews.go.com/WNT/video/twitter-revolution-tunisia-strongman-ruling-leader-12629386 Egypt http://thenextweb.com/socialmedia/2011/02/18/the-egyptian-revolution-explosion-on-twitter-video/ http://www.bing.com/videos/search?q=Twitter+Revolution+Egypt+video&view=detail&mid= 497601D814E4DA27F64B497601D814E4DA27F64B&first=0&qpvt=Twitter+Revolution+Egypt +video Libya http://abcnews.go.com/ThisWeek/video/target-libya-abc-news-reporters-armed-conflict-libya-gadhafipolitics-13178760 Human Geography Summer Session 2014 9 Lesson 6a: China and Thailand: RNI Problems and Solutions Country Problem China Solution How Implemented One child policy High population growth rate Thailand High population growth rate Make birth control very available Successful – Why or Why Not No – not enough education about family planning, forced abortions, girls neglected, not enough workers to support the retirees Rewards – 5-10% salary bonus, preferential treatment for food, housing health care, education, employment Punishment – 10% salary deduction Handed out condoms at Yes – cut pgr from movie theaters, traffic 3.2% to 1.6% in 15 jams years Birth Control supermarkets Free vasectomies Rx for Survival – this link will take you to a clip about Mechai Vervaidya AIDS in Thailand from Program 3, Delivering the Goods http://www.pbs.org/wgbh/rxforsurvival/series/video/c_mec_dis_aidsthailand1.html Lesson 6b: Silent Spring: The tragedy of India’s never-born girls Patricia Leidl, published by UNFPA, the United Nations Population Fund www.unfpa.org/swp Have students read through each paragraph from the article and pull out the main ideas and/or what they think after reading the paragraph. 1. Married at the age of 18 in the northern state of Rajasthan, Ranu has been pregnant seven times. Ranu and her husband Muktar killed their first two children by strangling them hours after their birth. Both were girls. Two sons died from infections acquired in infancy, two other pregnancies were terminated because the fetuses were female. Ranu is understandably protective of the small boy that today is her only living offspring. Nevertheless she remains defiant. “We will kill other children if they are born girls,” she says, adding that she has no money to pay for their weddings. 2. Her husband Muktar seems unconcerned over the fate of his ‘missing’ daughters. And why should he be? In districts all over the state, and indeed, all over the country, the elimination of girl children, either through sex-selective abortion or infanticide, goes largely uncensured, undetected, unpunished and unmourned. The girl child is killed by putting a sand bag on her face or by throttling her. It is not a rare incident. It happens without any hindrance. Human Geography Summer Session 2014 10 3. Today, throughout India, parents are increasingly forgoing outright infanticide in favor of cheap and widely available technologies that allow parents to know if the fetus is female, and then to abort it. The availability of amniocentesis in the 1980s and later, ultrasound, has enabled families to rid themselves of unwanted girls before birth. Interestingly, sex selection crosses all economic boundaries, from the poor and illiterate to the educated and prosperous. 4. In March 2001, India’s population was estimated to be 1.03 billion, up from 967 million in 1997. What did not rise, however, but rather—declined sharply—was the proportion of females in the 0 to 6-year age range. Although the natural sex ratio slightly favors boys at birth, sex ratios have been steadily plunging from 976 girls born for every 1000 boys in 1961, to 927 girls born to every 1000 boys in 2001 and, according to the latest numbers, 896 girls born for every 1000 boys. In a number of regions in India however, ratios have now plummeted to 800 girls born for every 1000 boys. In two small towns in the prosperous region of the Punjab, the 2001 census revealed that the female-to-male sex ratio had declined to a dismal 754 girls born to every 1000 boys. 5. In India, a preference for sons is influenced by social and economic factors that relegate girls to the status of burden. Parents desire sons because they carry on the family name, inherit family property and, in the absence of retirement plans, are often considered to be the sole means of support for aging parents. The high costs of providing a dowry means daughters are often viewed as paraya dhan (to be married and sent away)—another reason why females are singled out for abortion or infanticide. In many regions, women who fail to deliver boys are harassed by their in-laws or thrown out on the street. 6. Although there are laws that ban sex-determination testing on fetuses, fully 60 million girls are now ‘missing’. According to government reports, as many as 2 million fetuses are aborted each year for no other reason than they happen to be female. In Punjab, the government claims that the numbers of missing girls will increase by 40 per cent in the forthcoming generation. Furthermore, while laws may be an important first step towards the elimination of aborting female fetuses, the deeper problem of gender discrimination needs to be addressed alongside effective law enforcement. 7. Although the Indian government is striving to control the use of ultrasound and operators are now forbidden to reveal the sex of fetuses, in many regions enforcing the law remains spotty to nonexistent. While many medical practitioners are ethical and follow the law, some have set up black market ultrasounds, making a lot of money from families who want to know if a fetus is a boy or girl. Experts also note that the fact that female birth rates are lowest among the most well off points to a demand that shows no sign of subsiding—despite new laws. “If you can afford to buy a car, a refrigerator and a microwave, then maybe you can afford to make sure you have a son as well Human Geography Summer Session 2014 11 Lesson 6c: What’s Going On? Girls’ Education in India http://www.thirteen.org/edonline/wideangle/lessonplans/girlsspeak/ What is happening with her education? Looking back at Lesson 3b, what do you predict this girl’s future will be like? Aarti http://www.youtube.com/watch?v=MlCippE9hY0 Leela http://www.youtube.com/watch?v=YLPXEepSdIo Geetha http://www.youtube.com/watch?v=YLPXEepSdIo Lesson 7a : India Readings Problem Solution Reading 1 Reading 2 Reading 3 Human Geography Summer Session 2014 12 Lesson 7b: How Do Governments Encourage Family Planning? In your small group, analyze the population posters from China, India and Kenya to find out how governments encourage their citizens to use family planning. Poster A How does this poster encourage Chinese to have just one child? What would you title this poster? Poster B What is this poster trying to convey to Chinese (look at the symbols inside 2000)? What would you title this poster? Poster C How does this poster show having a smaller family is happier?? What would you title this poster? Poster D What is this poster trying to show Indian parents about having daughters? What would you title this poster? Poster E What do you think is happening in this poster? What would you title this poster? Poster F What is the message of the poster? What would you title this poster? Human Geography Summer Session 2014 13 Lesson 8b: Readings - Not Enough Babies http://www.pbs.org/newshour/updates/globalhealth/july-dec11/russia_11-08.html (video clip is for Russia) What’s going on Russia Birth rate is higher than death rate What contributes to falling birth rates or high death rates Men don’t take care of health Solutions Alcohol and tobacco * myths about drinking * cheap and available Tax alcohol and tobacco Health care * not very good * men don’t go to the doctor Japan Women are having fewer and fewer children Population of working adults is getting smaller Fewer workers to support retirees Women marry later or not at all Italy The fertility rate - at 1.33 children per woman one in five of the population in Italy is now over 65. 14 million fewer Italians by the year 2050. Better health care Government encourages births * baby bonuses * posters Supporting daycares Gender equal society Support groups for young mothers and newborn children Reduce retiree benefits Strengthen Japanese industry and trade Import workers Plus One Plan – reduce workloads for fathers so they will have more time to spend with their children Voluntary euthanasia single women now work hard to avoid the responsibilities of childcare. An increasing proportion of educated women no longer want to be just mothers and wives Baby bonus they can't afford it "A lot of Italian men do nothing around the house," France .68 PGR Fertility Rate 1.916 75 million by 2050 80% of women have jobs Human Geography, Teacher Summer Session 2014 Monthly allowance per child Large family card Tax deduction for home help State nursery schools Tax credit for child minders 14 LESSON 9A: GET THE WORD OUT Role: You are a member of an organization that wants to inform your citizens about what is happening with your country’s population and encourage them to change their behavior Audience Japan, Italy and France are countries that have decreasing populations and have begun implementing solutions to try to increase birth rates. Thailand wants to keep encouraging its citizens to use birth control. China and India want to stabilize their population and promote gender equity Topic: The message about population needs to fit what is happening with the country’s population (Place) Format: Poster, T-shirt, billboard Title or short message connected to the country and its plan Neat and colorful graphics that informs/encourages citizens Information that lets the viewer know what country the poster is for (name, flag, language) Human Geography, Teacher Summer Session 2014 15 Lesson 10a: Demographic Transition Model notes Blue – these are notes given to students Purple – students construct these notes by comparing stages using Population Reference Bureau and Lesson 11a Birth Rate and Death Rate determine how fast a population is growing Stage 1 Stage 2 Stage 3 Stage 4 Stage 5 birth rate is less than high birth and death high birth rate, falling birth rate begins to low birth and death death rate rates (10 apart) death rate decrease, death rate rate remains low zero growth or population grows population grows very slow growth negative growth slowly rapidly population grows stable population slowly (PGR 1-2%) or (PGR less than 1%) before modern times is slowing down (pyramid) (pyramid) (pyramid) RNI 2+ RNI closer to 0 RNI 1-2% infant mortality is infant mortality is higher infant mortality is lowest decreases from Stage 2 life expectancy is life expectancy is lower life expectancy highest increases from Stage 2 total fertility is total fertility is lowest higher total fertility is lower than Stage 2 urbanization is high urbanization is lower urbanization is higher major diseases risk is than Stage 2 low major diseases risk is higher major diseases risk is literacy is high lower than Stage 2 literacy is lower % unemployed is literacy increase lower % unemployed is from Stage 2 higher % unemployed decreases from Stage 2 Human Geography, Teacher Summer Session 2014 16 Lesson 10b: Population Reference Bureau Clarify for students what is ‘More Developed’, ‘Less Developed’, ‘Least Developed’ Regions - Where are MDC, Less Developed, LDC 1. What is the RNI of More Developed? ___ .2% ____________________________________ 2. What is the RNI of Less Developed (both)? ___ 1.4%, 1.7% _________________________ 3. What is the RNI of Least Developed? ________ 2.4% ______________________________ 4. What is the world average for RNI? __________ 1.2% ______________________________ 5. What happens to the birth rate as you move from Most Developed to Least Developed? __ it decreases _______________________________________ 6. Which region of the world has the fastest growing population? ______________________ Eastern Africa _____________________________________ 7. Which country in the region for #6 is growing the fastest? What is its RNI? ___________ Uganda, 3.4% _____________________________________ 8. What stage in the Demographic Transition model is the country from #7 country? _______ Stage 2 __________________________________________ 9. Which region of the world has a negative rate of natural increase? ____________________ Eastern Europe ___________________________________ RNI * Fastest Growth * Slowing Growth *Slowest growth/Stable * Negative World 1.2 Bangladesh 1.6 Brazil 1 China .5 India 1.6 Indonesia 1.5 Japan -.0 Nigeria 2.6 Pakistan 2.3 Russia -.03 U.S. .6 10. 11. 12. 13. 14. 15. 16. 17. 18. 19. 20. Formative Assessment You already know that Stage 1 has a very low RNI, around 0% and that Stage 5 countries have a negative RNI. What we have not yet determined is what is the range of RNI for Stage 2, Stage 3 and Stage 4 countries. Give a range of RNIs that would cover each stage. If you are unsure where to begin formulating a range, look at the RNIs above and put them in order from highest to lowest. Next, categorize them into fastest growing, slower growing and slowest growth/stable. Use these numbers as a guide to determine the range for the RNI of countries in each stage. Stage 1 (slow growth): 0% Stage 2 (fastest growth): ______% to ______ % Stage 3 (slowing growth): ______% to ______ % Stage 4: (slowest growth/stable): 0 to ______ % Stage 5: any RNI below 0 Human Geography, Teacher Summer Session 2014 17 Lesson 10c: Mapping Regions – remember to outline regions Stage 2 Stage 3 Stage 4 Stage 5 Does not fit model * __________________________________________________________________________________________________________________ * Southern Africa does not fit the model. Its RNI is .7%, which would make it Stage 4. However, this is due to high birth rates AND high death rates, rather than low birth rates and death rates. Human Geography, Teacher Summer Session 2014 18 Lesson 11a: Countries in the Model RNI Birth Rate Death Rate Cameroon 32.5 11.6 2.09 2 Algeria 22 4 1.8 2-3 Nigeria 39 13.5 2.55% 2 Spain 10 8.9 .11 4 Bulgaria 9 14 -.5 5 Russia 12 14 -.2 5 Pakistan 24 7 1.7% 2-3 India 20.6 7.4 1.32% 3 Bangladesh 22.5 5.7 1.68% 2-3 Japan 8.4 9 -.06% 5 Indonesia 17.7 6.3 1.14% 3 China 12.3 7 .53 2 Peru 19 6 1.3% 2 Columbia 17 5 1.2% 2 Brazil 15 7 .8% 2 Canada 10 8 .2% 4 Mexico 19 5 1.4% 3 U.S. 14 8 .6% 4 Human Geography, Teacher Summer Session 2014 Stage A. B. 19 C. Lesson 11b: Population Reference Bureau A B C D 1. What letter is Romania on the chart above? RNI -0.2% __F___ 2. What letter is Cambodia on the chart above? RNI 1.7% __C __ 3. What letter is Malawi on the chart above? RNI 3.1% __ B __ 4. What letter is South Korea on the chart above? RNI 0.4% __ E __ 5. What letter is Mozambique on the chart above? RNI 2.7% __ A __ 6. What letter is Vietnam is on the chart above? RNI 1.4% __ D __ E F Find six countries, one for each letter on the chart below. Write the name of the country that could match the position on the transition model. Record the counties’ RNI 7. A __________________________________________ 8. B __________________________________________ 9. C __________________________________________ 10. D __________________________________________ 11. E __________________________________________ 12. F __________________________________________ A B C D E F Lesson 11c: Life in Transition Examine each population pyramid below to determine which stage its population is in. After you have determined the stage, look back at your notes from Lessons 10a and 10b and write a short description about what life could be like in that country. Lesson 11c: Reflection Answer the following using thoughtful answers, complete sentences and correct grammar. Write your response on a separate sheet of paper. You live in the United States of America, a Stage 4 country. Based on the demographics from Lesson 10a, what does this mean for your life? How would your life be different if you lived in a Stage 2 country? Human Geography, Teacher Summer Session 2014 21 Lesson 12a: Vocabulary Migration: movement by humans from one area to another, sometimes over long distances or in large groups Pull Factors: Reasons why human move to an area * * * Push Factors: Reasons why humans leave an area * * * Rural areas in the country associated with agriculture and low population density Urban cities and towns, higher population density Forced Migration forcing people to move from their homes. Usually done by a government to take control of land or to move a group to one central location Lesson 12b: Push and Pull Factors http://www.thirteen.org/edonline/wideangle/video_bank_location.html http://www.thirteen.org/edonline/wideangle/search.html?cx=008853845758841447609%3Aij5k5uebjta&q=to+have+and+have+not&submit.x=0&sub mit.y=0&cof=FORID%3A9 Migration from one country to another Migration Within a country - China Push Zimbabwe Push Rural http://www.thirteen.org/edonline /wideangle/videobank/tohave_farm .html Pull Botswana Pull Urban http://www.thirteen.org/edonline /wideangle/videobank/tohave_migr ant.html Human Geography, Teacher Summer Session 2014 22 Lesson 12c: Population Migration Create a map that shows which regions people are leaving and which regions they are going to. Human Geography, Teacher Summer Session 2014 23 Lesson 13a: Foreign Born Migration by State You will be creating map for the U.S. showing either the foreign born population by state for 1990-2000 or 2000-2010. When you are done with your map, you and a partner will compare your maps and generate ‘I wonder why…’ questions. Hmong Migration KW-L Human Geography, Teacher Summer Session 2014 24 Lesson 14a: Know Lesson 14b: What Lesson 14c: Learn http://www.asian-nation.org/hmong.shtml Human Geography, Teacher Summer Session 2014 25
