osmosis lab 2013.doc
advertisement
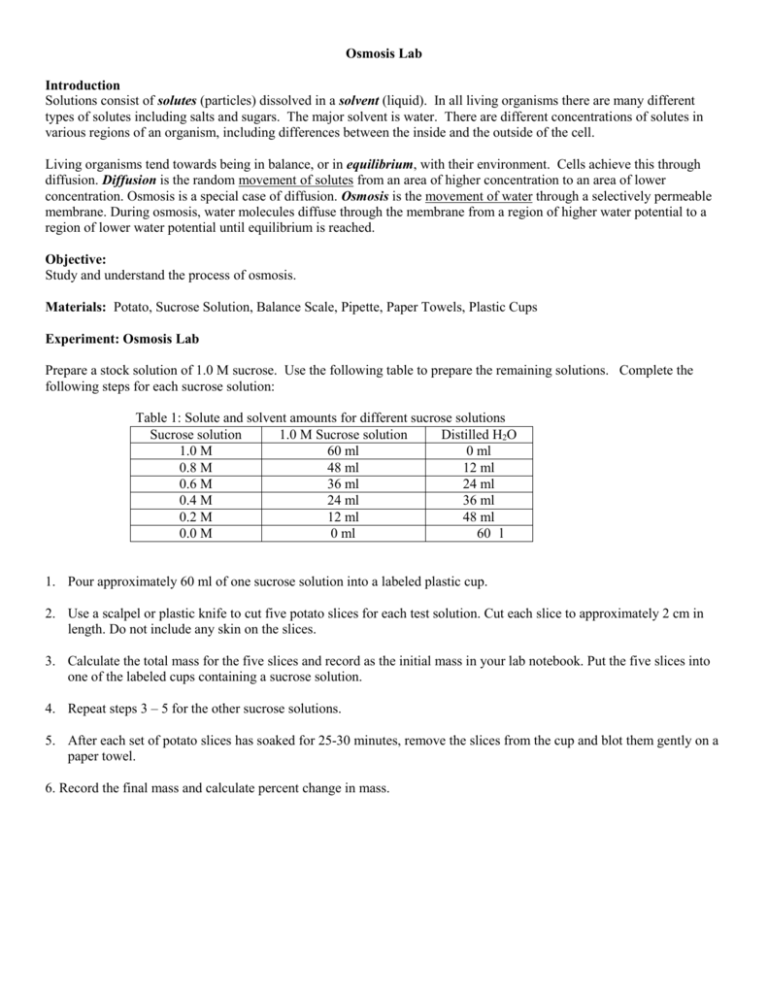
Osmosis Lab Introduction Solutions consist of solutes (particles) dissolved in a solvent (liquid). In all living organisms there are many different types of solutes including salts and sugars. The major solvent is water. There are different concentrations of solutes in various regions of an organism, including differences between the inside and the outside of the cell. Living organisms tend towards being in balance, or in equilibrium, with their environment. Cells achieve this through diffusion. Diffusion is the random movement of solutes from an area of higher concentration to an area of lower concentration. Osmosis is a special case of diffusion. Osmosis is the movement of water through a selectively permeable membrane. During osmosis, water molecules diffuse through the membrane from a region of higher water potential to a region of lower water potential until equilibrium is reached. Objective: Study and understand the process of osmosis. Materials: Potato, Sucrose Solution, Balance Scale, Pipette, Paper Towels, Plastic Cups Experiment: Osmosis Lab Prepare a stock solution of 1.0 M sucrose. Use the following table to prepare the remaining solutions. Complete the following steps for each sucrose solution: Table 1: Solute and solvent amounts for different sucrose solutions Sucrose solution 1.0 M Sucrose solution Distilled H2O 1.0 M 60 ml 0 ml 0.8 M 48 ml 12 ml 0.6 M 36 ml 24 ml 0.4 M 24 ml 36 ml 0.2 M 12 ml 48 ml 0.0 M 0 ml 60 l 1. Pour approximately 60 ml of one sucrose solution into a labeled plastic cup. 2. Use a scalpel or plastic knife to cut five potato slices for each test solution. Cut each slice to approximately 2 cm in length. Do not include any skin on the slices. 3. Calculate the total mass for the five slices and record as the initial mass in your lab notebook. Put the five slices into one of the labeled cups containing a sucrose solution. 4. Repeat steps 3 – 5 for the other sucrose solutions. 5. After each set of potato slices has soaked for 25-30 minutes, remove the slices from the cup and blot them gently on a paper towel. 6. Record the final mass and calculate percent change in mass. Results: Complete a properly constructed raw data table for each experiment. The table for Experiment 2 should look like Table 2 (record ONLY numbers, NO units). Table 2: Mass (g) of potato slices at different sucrose concentrations (+/- 0.1g) Sucrose concentrations Initial Mass Final Mass Change in Mass % Change in Mass Average % Change in Mass 0.0 M sucrose 0.2 M sucrose 0.4 M sucrose 0.6 M sucrose 0.8 M sucrose 1.0 M sucrose Calculate the following: a. calculate the percent change in mass of each potato slice. (Final mass) – (Initial Mass) x 100 = percent change in mass Initial Mass b. calculate the average change in mass: (%change1 + %change2 + %change3 + %change4 + %change 5) = average percent change in mass 5 Processed Data: (we will do this in the computer lab) For this investigation you are required to write a full report with a date and title, introduction, hypothesis, variables, materials, methods, data collection, data processing, conclusion and evaluation. (Note: This lab will be marked against IB criteria.) The lab report must be TYPED and put into a binder to be kept in the classroom. Lab Report Procedure: 1. Introduction - Aim: A sentence stating the purpose of the lab or what the scientist wants to accomplish in the lab) Example Aim: To observe the osmotic effect of different sucrose concentrations on potatoes A. Title B. Research Question C. Background Information 2. Hypothesis - A hypothesis is an educated guess about how things work. A hypothesis can usually be written as an ‘If______ Then______’ statement. A hypothesis should be something that you can actually test - called a testable hypothesis. In other words, you need to be able to measure both "what you do" and "what will happen.") o Example Hypothesis: If the concentration of sucrose increases, then the mass of the potato will decrease. However, if the concentration of the solution in the beaker is less than that of the potato (such as distilled water), then the mass of the potato will increase. 3. Variables - (A variable is a factor that can influence the outcome of an experiment or factors that can affect a tests outcome. Experiments usually have three variables: dependent, independent and controlled) A. Dependent - the dependent variable is the response that is measured. It is what the investigator thinks will be affected during the experiment. B. Independent - the independent variable is the variable that is varied or manipulated by the researcher. It is what the investigator thinks will affect the dependent variable C. Control – The control of an experiment is the variable, which you keep constant. Since the investigator wants to study the effect of one particular independent variable, the possibility that other factors are affecting the outcome must be eliminated 4. Control of Variables - This is not the same as “the control” above! All the aspects of the experiment that must be kept constant to ensure that the tests/experiment is valid. There will be several of these not just one! You must be thorough and think of as many controlled variables as you can. That said, don’t include controlled variables that aren’t significant. For example if you’re measuring the growth of yeast then the temperature definitely needs to be controlled (assuming temperature is not your independent variable) but the same location is not going to be a significant factor. Your must explicitly indicate how each controlled variable identified in your variables section was controlled. If you can’t actively control a variable then your method should include a means of monitoring it. 5. Materials (list all the materials that were used) 6. Method - (A step-by-step process; can be replicated exactly by other scientists. The procedure may be a list but in complete sentences) 1. Label six beakers with six different concentrations of sucrose solutions (1.0 M sucrose, 0.2 M sucrose, etc.) 2. Fill the six beakers with the correct amount of sucrose solution previously labeled. 3. With the scalpel/plastic knife, cut five slices of potato. 4. Cut the ends of the potato cylinders, making them even on the edges and remove the skin. 5. Weigh the potato cylinders on an electronic balance and record their initial (pre-immersion) masses in a data table. 6. Insert five potato slices into each labeled beaker. (There should be five potato slices per beaker) 7. Record the date and time of potato slice immersion. 8. Leave the potatoes in the beakers for 30 minutes. 9. After 30 minutes, take out all potato slices and record date and time of extraction. 10. Blot the potatoes with paper towel removing excess water. 11. Weigh the potato slices on an electronic balance and record their final (post-immersion) mass in a data table. 12. Calculate the average percent change in mass and length of the potato cylinders. 7. Data Collection - (A record of raw data – includes tables, annotated drawings, & observations. Raw data is actual data measured) A. Record raw data in a table. (Use appropriate significant figures, units, and levels of uncertainty for quantitative reading) B. Record observations. (You can make a note of observations pre- and post- potato immersion) 8. Data Processing - (Includes the presentation of raw data graphically or as a table, and calculations of change, proportion, percentage or other statistical value if needed) these come from the calculations from the lab A. Record your calculated data in a data table. B. Graph the average percent change for both mass using Microsoft Excel. 9. Conclusion - (Describe your results in written form) A. State a conclusion based on the findings (analyze your processed data and draw a conclusion). B. Justify/explain your conclusion with a reasonable interpretation of the data. (What do the results show? Are there any trends? What can you interpret from the results? Relate your comments back to processed data tables and graphs) C. Justify your conclusion and findings using appropriate literature. (Is your conclusion right? Is your conclusion wrong? Can you explain any unexpected results? Compare your experimental results with textbook or literature values. The literature consulted should be fully referenced.) 10. Evaluation - (Evaluate/assess your experiment) A. Evaluate the method, errors, limitations, and weaknesses. (What are the sources of error in my method, manipulation, and/or analysis? Comments about the precision and accuracy of the measurements are relevant here. When evaluating the procedure used, specifically look at the processes, use of equipment and management of time.) B. Suggest realistic improvements in respect of identified weaknesses and limitations (suggestions should be based on the weaknesses and limitations identified in aspect 2. Address modifications to experimental techniques and data range. Modifications should be realistic and clear - ex. do not state generally that more precise equipment needs to be used – you must be more specific)
