Title: Mean, Median, Mode
advertisement

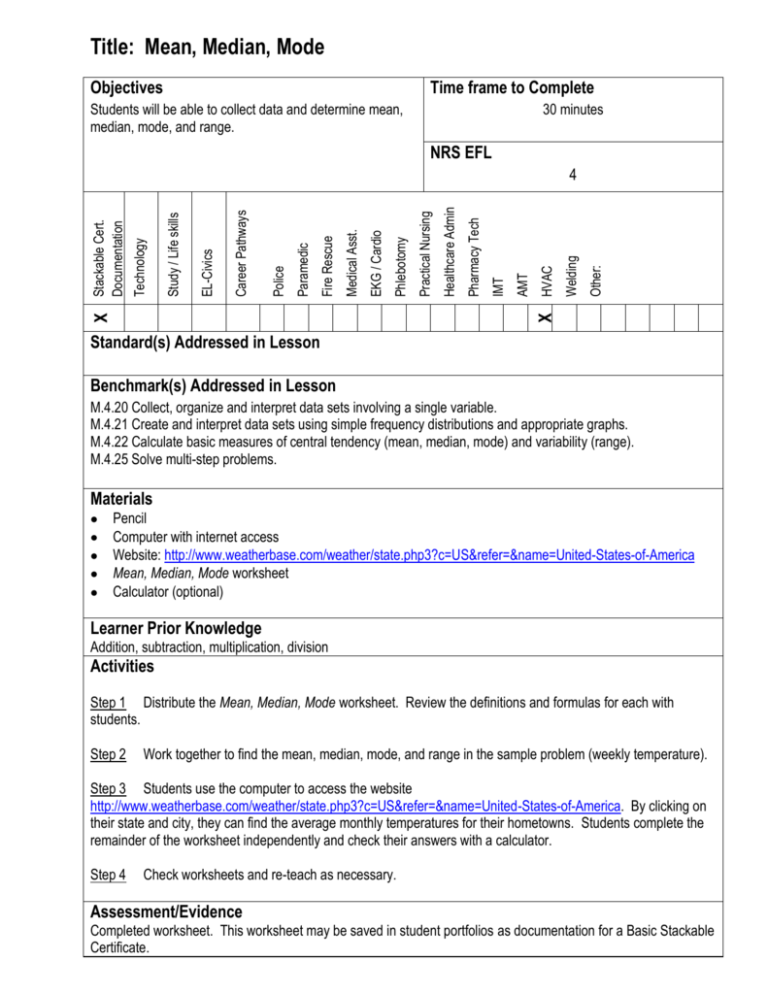
Title: Mean, Median, Mode Objectives Time frame to Complete Students will be able to collect data and determine mean, median, mode, and range. 30 minutes NRS EFL Other: Welding HVAC X AMT IMT Pharmacy Tech Healthcare Admin Practical Nursing Phlebotomy EKG / Cardio Medical Asst. Fire Rescue Paramedic Police Career Pathways EL-Civics Study / Life skills Technology X Stackable Cert. Documentation 4 Standard(s) Addressed in Lesson Benchmark(s) Addressed in Lesson M.4.20 Collect, organize and interpret data sets involving a single variable. M.4.21 Create and interpret data sets using simple frequency distributions and appropriate graphs. M.4.22 Calculate basic measures of central tendency (mean, median, mode) and variability (range). M.4.25 Solve multi-step problems. Materials Pencil Computer with internet access Website: http://www.weatherbase.com/weather/state.php3?c=US&refer=&name=United-States-of-America Mean, Median, Mode worksheet Calculator (optional) Learner Prior Knowledge Addition, subtraction, multiplication, division Activities Step 1 Distribute the Mean, Median, Mode worksheet. Review the definitions and formulas for each with students. Step 2 Work together to find the mean, median, mode, and range in the sample problem (weekly temperature). Step 3 Students use the computer to access the website http://www.weatherbase.com/weather/state.php3?c=US&refer=&name=United-States-of-America. By clicking on their state and city, they can find the average monthly temperatures for their hometowns. Students complete the remainder of the worksheet independently and check their answers with a calculator. Step 4 Check worksheets and re-teach as necessary. Assessment/Evidence Completed worksheet. This worksheet may be saved in student portfolios as documentation for a Basic Stackable Certificate. Adaptations for Beginning Students Beginning students may use a calculator and have extended time to complete the assignment. Adaptations for Advanced Students Advanced students may collect additional data for comparison such as daily high/low temperatures or temperatures from cities in different geographic regions. Teacher Reflection/Lesson Evaluation This lesson was created by Middletown ABLE. Mean The average of a set of numbers. To find the mean, add all of the numbers in the set, then divide by how many numbers were added together. Median The number that appears in the middle of the data set. To find the median, write all numbers in the data set in order from lowest to highest, then find the value that appears exactly in the middle. If using a data set with an even number, you will have to find the average of the two numbers that appear in the middle of the set. Mode The value that appears most often in a data set. If no values repeat, there is no mode. There can be more than one mode. Range The range is the difference between the lowest and highest numbers in the data set. To calculate the range, subtract the lowest value from the highest value in the set. Consider these temperatures: Sunday Monday Tuesday Wednesday Thursday Friday Saturday 52 46 53 58 70 66 58 What is the mean? What is the median? What is the mode? What is the range? 1. Survey your classmates. Ask them the temperature at which they keep their thermostats set. Record your findings. 2. Find the average temperature of your classmates’ homes. 3. What is the range of temperature in your classmates’ homes? 4. What temperature is the median temperature of your classmates’ homes? 5. If one exists, identify the mode. 6. Visit the website http://www.weatherbase.com/weather/state.php3?c=US&refer=&name=United-States-of-America. Click your state and find the city closest to your hometown. Click the city to view the temperatures for the past year. Record the average monthly low temperatures. 7. What is the range of low temperatures in the past year? January February March April May June July August September October November December 11. 8. What is the median low temperature? 9. Identify the mode in this data set. 10. Calculate the mean of this set of low temperatures. Create a graph that illustrates the monthly low temperatures. Mean The average of a set of numbers. To find the mean, add all of the numbers in the set, then divide by how many numbers were added together. Median The number that appears in the middle of the data set. To find the median, write all numbers in the data set in order from lowest to highest, then find the value that appears exactly in the middle. If using a data set with an even number, you will have to find the average of the two numbers that appear in the middle of the set. Mode The value that appears most often in a data set. If no values repeat, there is no mode. There can be more than one mode. Range The range is the difference between the lowest and highest numbers in the data set. To calculate the range, subtract the lowest value from the highest value in the set. Consider these temperatures: Sunday 52 Monday 46 Tuesday 53 Wednesday 58 Thursday 70 Friday 66 Saturday 58 What is the mean? 403/7 = 57.6 What is the median? 58 What is the mode? 58 What is the range? 70-46 = 24 1. Survey your classmates. Ask them the temperature at which they keep their thermostats set. Record your findings. Answers will vary throughout this assignment 2. Find the average temperature of your classmates’ homes. 3. What is the range of temperature in your classmates’ homes? 4. What temperature is the median temperature of your classmates’ homes? 5. If one exists, identify the mode. 6. Visit the website http://www.weatherbase.com/weather/state.php3?c=US&refer=&name=United-States-of-America. Click your state and find the city closest to your hometown. Click the city to view the temperatures for the past year. Record the average monthly low temperatures January February March April May June July August September October November December 7. What is the range of low temperatures in the past year? 8. What is the median low temperature? 9. Identify the mode in this data set. 10. Calculate the mean of this set of low temperatures. 11. Create a graph that illustrates the monthly low temperatures.


