The Median Voter Theorem and its Applications
advertisement
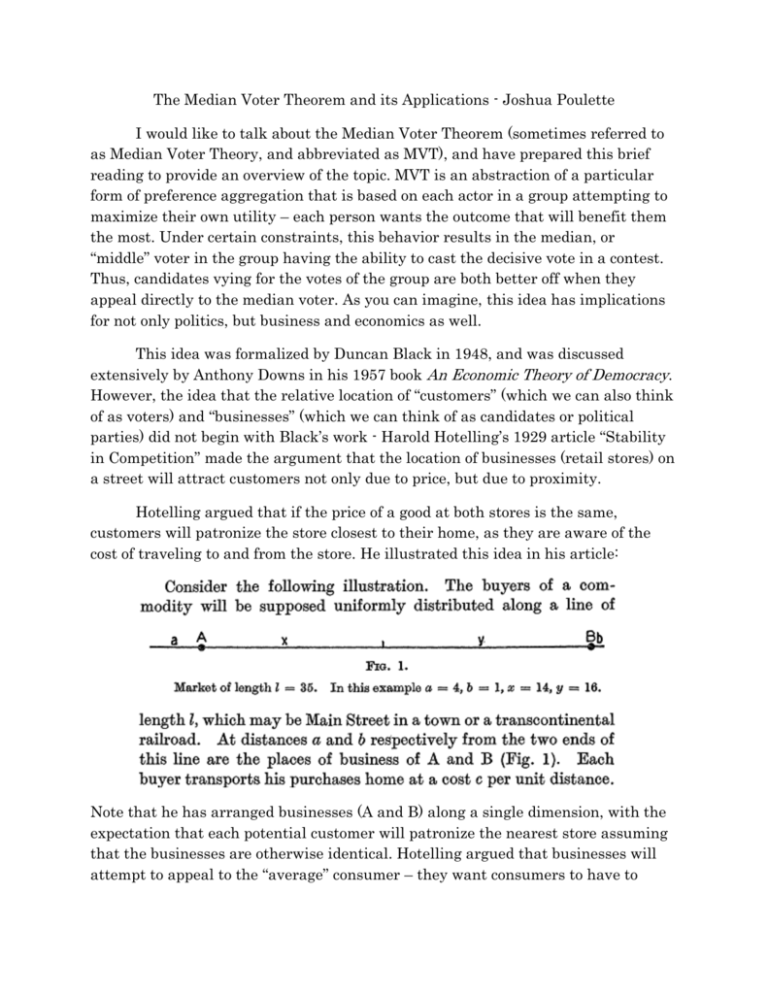
The Median Voter Theorem and its Applications - Joshua Poulette I would like to talk about the Median Voter Theorem (sometimes referred to as Median Voter Theory, and abbreviated as MVT), and have prepared this brief reading to provide an overview of the topic. MVT is an abstraction of a particular form of preference aggregation that is based on each actor in a group attempting to maximize their own utility – each person wants the outcome that will benefit them the most. Under certain constraints, this behavior results in the median, or “middle” voter in the group having the ability to cast the decisive vote in a contest. Thus, candidates vying for the votes of the group are both better off when they appeal directly to the median voter. As you can imagine, this idea has implications for not only politics, but business and economics as well. This idea was formalized by Duncan Black in 1948, and was discussed extensively by Anthony Downs in his 1957 book An Economic Theory of Democracy. However, the idea that the relative location of “customers” (which we can also think of as voters) and “businesses” (which we can think of as candidates or political parties) did not begin with Black’s work - Harold Hotelling’s 1929 article “Stability in Competition” made the argument that the location of businesses (retail stores) on a street will attract customers not only due to price, but due to proximity. Hotelling argued that if the price of a good at both stores is the same, customers will patronize the store closest to their home, as they are aware of the cost of traveling to and from the store. He illustrated this idea in his article: Note that he has arranged businesses (A and B) along a single dimension, with the expectation that each potential customer will patronize the nearest store assuming that the businesses are otherwise identical. Hotelling argued that businesses will attempt to appeal to the “average” consumer – they want consumers to have to “travel” as little as possible. This can refer to physical travel as in the “shops on a street” example or comfort level with some aspect of a commodity, such as the sweetness of candy. Thus, businesses often end up producing very similar goods in an attempt to appeal to as many customers as possible. While Hotelling was primarily concerned with the behavior of firms and customers, he recognized that this convergence by businesses applies to other arenas as well – we can think of political parties trying to appeal to voters in the same way we think about businesses trying to attract customers. Here is what Hotelling had to say on the subject: Remember, Hotelling wrote this article in the mid-late 1920s! Other than the fact that in this time period “fanatical free-traders” were fiercely loyal to the Democratic Party much of this selection is directly applicable to modern politics. Surely you have all heard remarks (and likely have made such remarks yourselves) on the seeming cautiousness and platform convergence of modern politicians. Hotelling reminds us that this behavior is certainly nothing new, which suggests that some type of fundamental mechanism or behavior is at work here. I will discuss this example in more detail, but briefly consider the following arrangement (in contrast to the Hotelling example of stores on a street). Imagine a beach, with a population of sunbathers and tourists. Now consider the presence of two ice cream carts at the beach. What types of behavior do you expect from the beach patrons (assuming they want to buy ice cream)? From the ice cream vendors? In what ways is this example different from that discussed in the Hotelling article? Duncan Black argued that under certain constraints the position of the median voter “wins,” or is selected under majority rule, and that this outcome is a Nash equilibrium. That is, no actors have anything to gain by moving away from the position of the median voter (given what the other actors are doing). Let’s consider the nature of these constraints. 1. Assume that preferences are single-peaked. This is the assumption that individuals prefer points close to their own ideal point, and that they grow less satisfied as outcomes move farther from their ideal point. Consider a beachgoer in the picture above. The ideal for a beachgoer who wants to buy ice cream is that the cart is very near them: they won’t have to walk far and their ice cream will not melt before they get back to their chair. As the carts move farther away from an individual, they are less satisfied with the arrangement. Consider how this applies to voters and candidates: a candidate who is identical to a voter (in platform/policy preferences) is the ideal point for that voter – that is, there is no better outcome for that voter than the election of that candidate. However, as candidates differ from the position of that voter the voter becomes less satisfied with them. The above illustration represents this idea. The curved line represents the amount of utility (or happiness) Voter A associates with the platforms of each potential candidate. Candidate A and Voter A have identical policy platforms (which I presented on a generic left-right ideological dimension). Voter A receives less utility from Candidate B’s platform and less still from Candidate C’s platform. Note that the curved line has only one peak – at Voter A’s ideal point. All other points are less preferred. This is what is meant by “single-peaked preferences” – if preference curves have multiple peaks it is much more difficult to aggregate the preferences of a group and MVT does not apply (much less lead to an equilibrium). Of course, preferences need not be single peaked over a dimension. Can you think of an issue or area for which individuals might not have preferences that are single peaked? 2. Assume that preferences are being considered over a single dimension only. This constraint is rather straightforward: in the above example Voter A and Candidates A, B, and C are placed at points on a single line, or dimension. In this case, the line represents a left-right ideological policy platform, but it could represent anything. For instance, we could consider preferred level of education spending or preferred sales tax rate. We could also consider representing preferences on two of these areas at once. Consider a mix of preferences for spending on education and national defense. In this example, Voter A prefers high education spending and low defense spending, while Voter D prefers just the opposite. Voter B prefers high spending on both dimensions, while Voter C prefers low spending on both dimensions. MVT cannot find an equilibrium for such situations – it is restricted to settings in which only a single issue dimension is considered. MVT is certainly an abstraction from reality: it is a way of modeling certain behaviors or outcomes, and thus must depart from the “real world” in some ways. Which of these constraints (single peaked preferences vs. single issue dimension) do you feel is a more significant departure from reality? 3. Assume that there are 2 candidates or parties competing for voters. This constraint is not one of the original constraints defined by Black but is being included as we will be discussing MVT primarily from a political angle. We have considered MVT with the examples of shops on a street, ice cream carts on a beach, and a voter and their preferred policy platform. Let’s consider an election with voters and candidates (or parties). It is not a stretch to consider only 2 candidates as most of us are probably most familiar with the U.S. electoral system. The issue dimension in this case is a generic left-right ideological/political dimension. In this example I have drawn the ideal point and preference curve for voter 5, but you can imagine a similar curve for every other voter. This is a standard way in which political competitions are illustrated when discussing MVT. Candidates will place themselves (i.e., their platforms) at some point along this line and voters will respond to this placement by voting for whichever candidate is closer to their ideal point. What behavior do you expect from the candidates? From the voters? We will discuss extensions of this scenario, but keep this particular graph in mind. I understand that this is a fairly abstract topic so feel free to come with any questions you might have. See you soon.
