ANALYSIS OF PROPORTIONS (ANOP)
advertisement
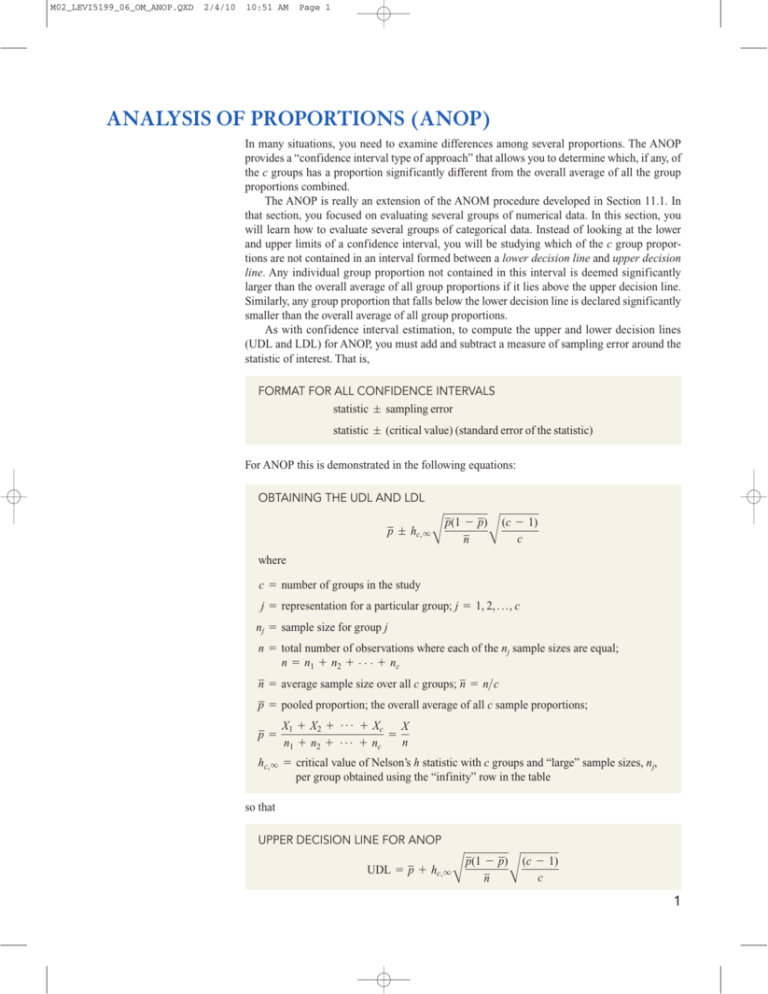
M02_LEVI5199_06_OM_ANOP.QXD 2/4/10 10:51 AM Page 1 ANALYSIS OF PROPORTIONS (ANOP) In many situations, you need to examine differences among several proportions. The ANOP provides a “confidence interval type of approach” that allows you to determine which, if any, of the c groups has a proportion significantly different from the overall average of all the group proportions combined. The ANOP is really an extension of the ANOM procedure developed in Section 11.1. In that section, you focused on evaluating several groups of numerical data. In this section, you will learn how to evaluate several groups of categorical data. Instead of looking at the lower and upper limits of a confidence interval, you will be studying which of the c group proportions are not contained in an interval formed between a lower decision line and upper decision line. Any individual group proportion not contained in this interval is deemed significantly larger than the overall average of all group proportions if it lies above the upper decision line. Similarly, any group proportion that falls below the lower decision line is declared significantly smaller than the overall average of all group proportions. As with confidence interval estimation, to compute the upper and lower decision lines (UDL and LDL) for ANOP, you must add and subtract a measure of sampling error around the statistic of interest. That is, FORMAT FOR ALL CONFIDENCE INTERVALS statistic ; sampling error statistic ; (critical value) (standard error of the statistic) For ANOP this is demonstrated in the following equations: OBTAINING THE UDL AND LDL p ; hc, q p(1 - p) (c - 1) B n B c where c = number of groups in the study j = representation for a particular group; j = 1, 2, . .., c nj = sample size for group j n = total number of observations where each of the nj sample sizes are equal; n = n 1 + n2 + . . . + n c n = average sample size over all c groups; n = n>c p = pooled proportion; the overall average of all c sample proportions; X1 + X2 + Á + Xc X = p = n n1 + n2 + Á + nc hc, q = critical value of Nelson’s h statistic with c groups and “large” sample sizes, nj, per group obtained using the “infinity” row in the table so that UPPER DECISION LINE FOR ANOP UDL = p + hc, q p(1 - p) (c - 1) B n B c 1 M02_LEVI5199_06_OM_ANOP.QXD 2 2/4/10 10:51 AM Page 2 Analysis of Proportions (ANOP) and LOWER DECISION LINE FOR ANOP LDL = p - hc, q B p(1 - p) (c - 1) n B c Note that Nelson’s h statistic is found from the combination of c groups with the “infinity” row for common group sample sizes. This is because the ANOP procedure expects the sample sizes to be large. The major assumption for applying the ANOP procedure is that the c group sample sizes be sufficiently large to enable the expected number of items of interest in each group to be at least 5. That is, nj pj Ú 5 and also nj(1 - pj) Ú 5. To demonstrate how the ANOP procedure is used, suppose that the Ramsey & Ramsey food processing plant funnels its baked cookies to sealing machines used for product packaging. In monitoring the process, Philip Pat, the product manager, finds that the quality of the seals, as defined by the proportion of defective seals, is at an unacceptably high level. Because Philip Pat feels that the temperature setting on the sealing machine may affect the quality of the seals, he designs an experiment in which five different temperature settings are evaluated. At each temperature setting, 500 boxes are sealed and examined for their seal quality. The following table presents the number of boxes with defective and non-defective package seals at each of the five temperature settings. Cross-Classification of Observed Frequencies from the Sealing Machine TemperatureSetting Experiment Sealing Machine Temperature Setting Packaging Result Defective seals Non-defective seals Totals No. 1 No. 2 No. 3 No. 4 No. 5 Totals 22 478 500 20 480 500 34 466 500 23 477 500 41 459 500 140 2,360 2,500 From the data you observe that with five temperature settings used to evaluate the sealing process for samples of 500 different boxes per temperature setting, there is no problem with the ANOP procedure assumption regarding expected numbers of defective and non-defective seals. To apply the ANOP procedure, you first need to compute the key statistics from the experiment as well as the critical value of Nelson’s h statistic. From the data displayed in the table above, you compute the following: p = = X1 + X2 + . . . + Xc X = n n1 + n 2 + . . . + n c (22 + 20 + 34 + 23 + 41) 140 = = 0.056 (500 + 500 + 500 + 500 + 500) 2,500 Because the estimated overall proportion of defective seals is 0.056, its complement, (1 - p), or 0.944, is the estimated proportion of non-defective or conforming seals. The critical values of Nelson’s h statistic for obtaining the 95% UDL and LDL are found in the following table. M02_LEVI5199_06_OM_ANOP.QXD 2/4/10 10:51 AM Page 3 3 Analysis of Proportions (ANOP) Selected Critical Values of Nelson’s h Statistic for Obtaining 95% Upper and Lower Decision Lines (UDL and LDL) Number of Groups, c Sample Size per Group, nj 4 5 6 7 8 10 12 15 20 “infinity” 3 4 5 6 7 2.79 2.67 2.60 2.55 2.52 2.49 2.46 2.43 2.40 2.34 2.85 2.74 2.68 2.65 2.62 2.59 2.56 2.55 2.53 2.47 2.88 2.79 2.74 2.71 2.69 2.66 2.64 2.62 2.61 2.56 2.91 2.83 2.79 2.77 2.74 2.72 2.70 2.68 2.66 2.62 2.94 2.87 2.83 2.80 2.79 2.76 2.75 2.73 2.71 2.68 Note: Values in italics were obtained through linear interpolation. Source: Table 2 of L. S. Nelson, “Exact Critical Values for Use with the Analysis of Means,” Journal of Quality Technology, 15(1), 1983. Reprinted with permission of the American Society for Quality. Given that you have five temperature settings (c = 5) and samples of 500 boxes per setting (nj = 500), the critical value of Nelson’s h statistic for the sealing machine temperature-setting experiment is h5, q = 2.56. You now compute the UDL and LDL as follows: UDL = p + hc, q p(1 - p) (c - 1) B n B c = 0.056 + (2.56) (0.056)(0.944) 4 500 B5 B = 0.056 + 0.0235 = 0.0795 and LDL = p - hc, q B p(1 - p) (c - 1) n B c = 0.056 - (2.56) (0.056)(0.944) 4 500 B5 B = 0.056 - 0.0235 = 0.0325 From the cross-classification table, the proportions of defective seals out of 500 boxes sampled for each of the five sealing machine temperature settings are p1 = 0.044 p2 = 0.040 p3 = 0.068 The following is a graphical display for the ANOP. p4 = 0.046 p5 = 0.082 M02_LEVI5199_06_OM_ANOP.QXD 4 2/4/10 10:51 AM Page 4 Analysis of Proportions (ANOP) The proportions of defective box seals for each of the five sealing machine temperature settings are plotted on the vertical axis. From top to bottom, the three horizontal lines represent the UDL, p (the pooled proportion or overall average of all five proportions of defective box seals combined), and the LDL. From this figure, you observe that the proportion of defective boxes produced by temperature setting 5 is significantly higher than the average proportion, based on all five temperature settings combined. You would suggest to the product manager Philip Pat that temperature setting 5 should not be used.


