APPLICATION NOTE
The Spectral Mismatch Factor
51
Newport Corporation
where E*sim(λ) is the absolute spectral irradiance of the solar
simulator and St (λ) is the spectral response of the test cell.
(The latter can be relative since it appears in the numerator
and denominator.) Note that area At algebraically cancels.
A reference solar cell is calibrated when its short-circuit
current is known with respect to an internationally accepted
set of test conditions called the Standard Test Conditions
(1 Sun or 1000 W/m2 of AM1.5G and a cell temperature of
25˚C). The 5800 K plasma in a Xenon-arc lamp simulates the
AM1.5G spectrum well, but a quartz tungsten halogen (QTH)
lamp can also be adequate. In the (indoor) reference cell
method for calibrating an unknown solar cell, a reference
solar cell is used to adjust the intensity of a solar simulator
until the short-circuit current produced by the reference cell
is equivalent to its calibrated short-circuit current. One
might then assume that the simulator is set to 1 Sun, i.e.,
that the total irradiance (at least where the reference cell is
located) is 1 Sun, and that to calibrate an unknown test cell
one can simply replace the reference cell by the unknown
cell and measure its short-circuit current. This is only the
case if the reference and the unknown solar cells exhibit
identical spectral responses or that the simulator spectrum
perfectly matches the reference spectrum AM1.5G. The latter
would be highly unlikely since the reference spectrum is
calculated using a numerical model of the atmospheresunlight interaction given theoretical values for barometric
pressure, precipitable water, ozone content, etc. It is also
often the case that the respective spectral responses of the
reference and unknown solar cells don’t quite match. These
spectral mismatches lead to a kind of measurement error
called spectral mismatch error that is quantified by the
spectral mismatch factor . If this factor is known, it can be
used to correct a solar cell’s electrical performance under
simulated sunlight to the reference condition of AM1.5G. We
will derive an expression for M that will allow us to relate the
spectrally corrected short-circuit current I tstc to its measured
value I tsim, or
We can form a similar ratio with the currents produced by the
reference cell in response to the reference and simulator
ref
ref
spectra Istc
and Isim
respectively. In the reference cell method,
the intensity of the simulator is adjusted until the reference
cell’s short-circuit current equals its short-circuit current under
ref
ref
= Istc
. Then the ratio of the two
reference conditions or Isim
can be set to 1, and
*
(3)
So that
E
(4)
E*
If we multiply (2) and (4) we get
*
(5)
*
or
(6)
where
The short circuit current produced by an unknown test cell
under standard test conditions (STC) can be expressed as
the integral of the product of the cell’s absolute spectral
response St (λ) and the reference spectral irradiance Estc(λ)
(7)
(1)
Then from (6) we get the important relation
where At is the area of the test cell, and λ1 and λ2 cover the
spectral range of the test cell. The fractional error between the
test cell’s short-circuit current under the simulator I tsim and its
short-circuit current under the reference spectrum I tstc is
(8)
ref
ref
or if we adjust the simulator so that I sim
= I stc
we get the simple
relation that
E*
(2)
The expression in (8) relates the performance of the test solar
cell under the simulator, i.e. in the laboratory, to its performance
E
2
under the reference conditions. This is the expression that we
were ultimately after. Note that in (7) the expression for M only
requires the relative simulator spectrum Esim(λ) and the relative
reference and test cell spectral responses Sref (λ) and St (λ) since
they all occur in the numerator and denominator, i.e.
multiplicative factors cancel so that only the shapes of the
curves matter. Another important feature of the spectral
mismatch factor as it is defined in (7), is that if St (λ) = Sref (λ)
over a wavelength range that covers the spectral response of the
test cell, then M→1 (the same is true
if Esim(λ) = Estc(λ)). Although the preceding analysis was
performed using the short-circuit current, it equally applies to
any current produced by the test cell at any bias voltage. In
fact, each I-V data point (of the I-V curve) should be corrected by
the spectral mismatch factor as is recommended in the ASTM
standard E948 before deriving the electrical performance
parameters.
extended scan. The instrument is calibrated with a NIST
spectral irradiance standard according to the ASTM standard
G138 entitled “Standard Test Method for Calibration of a
Spectroradiometer Using a Standard Source of Irradiance.”
A typical scan is shown in the following figure.
Instead of regarding the spectral mismatch factor as a current
correction factor, an alternative way to interpret M is the
fractional amount by which to adjust the intensity of the solar
simulator. The value of M will be greater than one (M > 1) if the
simulator produces too much light in the spectral region of the
test cell, and the simulator should be turned down accordingly.
The reverse situation is that M will be less than one (M < 1) if
there is too little light in the spectral region of the test cell, and
the simulator should be turned up by the same factor. So either
the I-V data is corrected or the simulator is adjusted by the
spectral mismatch factor. The general rule of thumb is to select
a reference cell and/or source spectrum such that the mismatch
factor satisfies 0.98 ≤ M ≤ 1.02.
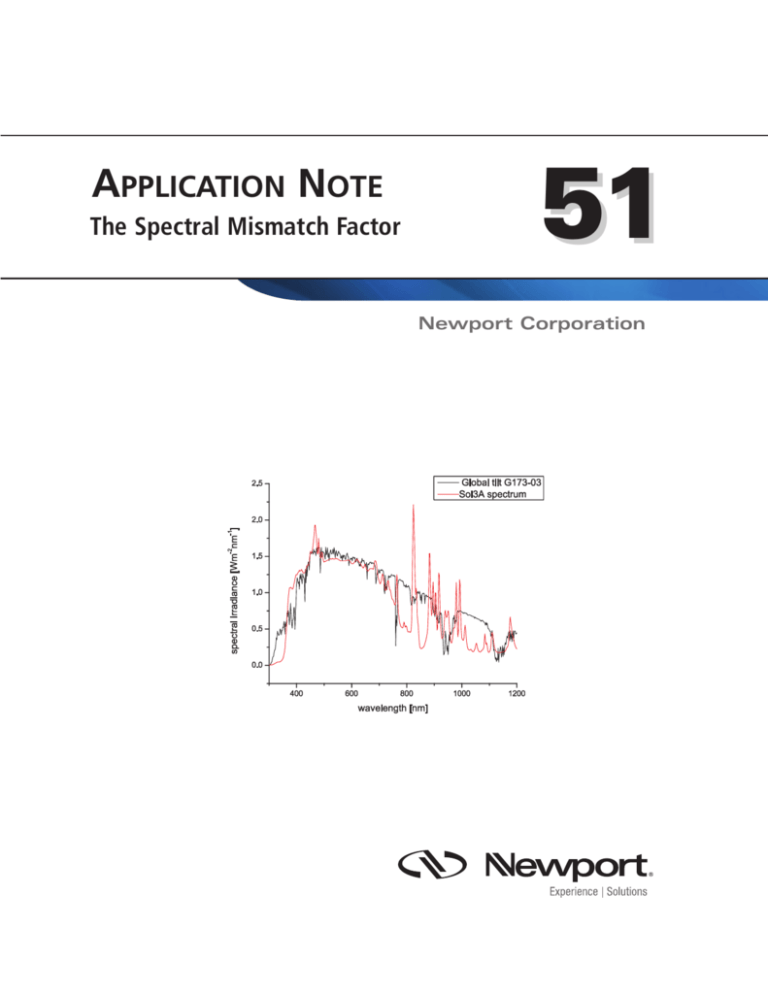
Shown is a typical Sol3A™ spectrum measured using the described spectroradiometer against the
reference spectrum (global tilt) as tabulated in ASTM G173-03 (available at
http://rredc.nrel.gov/solar/spectra/am1.5/) Note the characteristic peaks of Xenon starting at 800 nm.
The spectral response of the test solar cell is measured using an
instrument also based around an Oriel CS-130 monochromator
called the IQE-200™ available from Newport Corporation. It is
shown below.
The Oriel IQE-AC family of automated solutions for measuring PV spectral response
Shown is the spectroradiometer in position at the center of the simulator beam to measure the
spectrum of our 8 inch Sol3A solar simulator.
The table above (calculated using the above solar simulator
spectrum) indicates by how much the choice of reference cell with
respect to the device under test matters and how significant the
spectral error will be if it’s not chosen carefully. For example,
choosing a KG5 filtered mono-crystalline silicon reference cell to
measure a CIGS sample would introduce more than 10%
measurement error. Measuring an OPV sample against a GaAs
reference cell can result in 8.5% error. The spectral mismatch factor
can eliminate the errors associated with any combination of
reference cell and DUT material per the expression in (7) and/or
from any source of light that deviates from the standard AM1.5G
reference spectrum.
At the Newport TAC – PV Lab the solar simulator spectrum
Esim(λ) is measured with an absolute spectroradiometer
pictured above. The instrument is based around an Oriel®
Cornerstone™ 130 (CS-130) scanning grating monochromator, a
4 inch integrating sphere (Model 70672) to introduce light into
the monochromator. Light was detected after the exit slit of the
monochromator with either the UV enhanced silicon or the IG
(InGaAs) versions of the Newport 818 Series of Low Power
Detectors. The UV model is used for scanning from 300 to 1200 nm;
and the IG model is used from 1100 to 1550 nm. The two
radiometry scans are then stitched together to make one
3
Newport Corporation
Worldwide Headquarters
1791 Deere Avenue
Irvine, CA 92606
(In U.S.): 800-222-6440
Tel: 949-863-3144
Fax: 949-253-1680
Email: sales@newport.com
Visit Newport Online at: www.newport.com
This Application Note has been prepared based on development activities and
experiments conducted in Newport’s Technology and Applications Center and the results
associated therewith. Actual results may vary based on laboratory environment and
setup conditions, the type and condition of actual components and instruments used
and user skills.
Nothing contained in this Application Note shall constitute any representation or
warranty by Newport, express or implied, regarding the information contained herein or
the products or software described herein.
Any and all representations,
warranties and obligations of Newport with respect to its products and software shall be
as set forth in Newport’s terms and conditions of sale in effect at the time of sale or
license of such products or software. Newport shall not be liable for any costs,
damages and expenses whatsoever (including, without limitation, incidental, special and
consequential damages) resulting from any use of or reliance on the information
contained herein, whether based on warranty, contract, tort or any other legal theory, and
whether or not Newport has been advised of the possibility of such damages.
Newport does not guarantee the availability of any products or software and reserves the
right to discontinue or modify its products and software at any time. Users of the
products or software described herein should refer to the User’s Manual and other
documentation accompanying such products or software at the time of sale or license for
more detailed information regarding the handling, operation and use of such products
or software, including but not limited to important safety precautions.
This Application Note shall not be copied, reproduced, distributed or published, in
whole or in part, without the prior written consent of Newport Corporation.
Copyright ©2013 Newport Corporation. All Rights Reserved. The Newport “N” logo is a registered trademarks of Newport Corporation.
Newport Corporation, Irvine, California, has been certified
compliant with ISO 9001 by the British Standards Institution.
DS-011305


