Sum and Product
This problem gives you the chance to:
• use arithmetic and algebra to represent and analyze a mathematical situation
•
solve a quadratic equation by trial and improvement
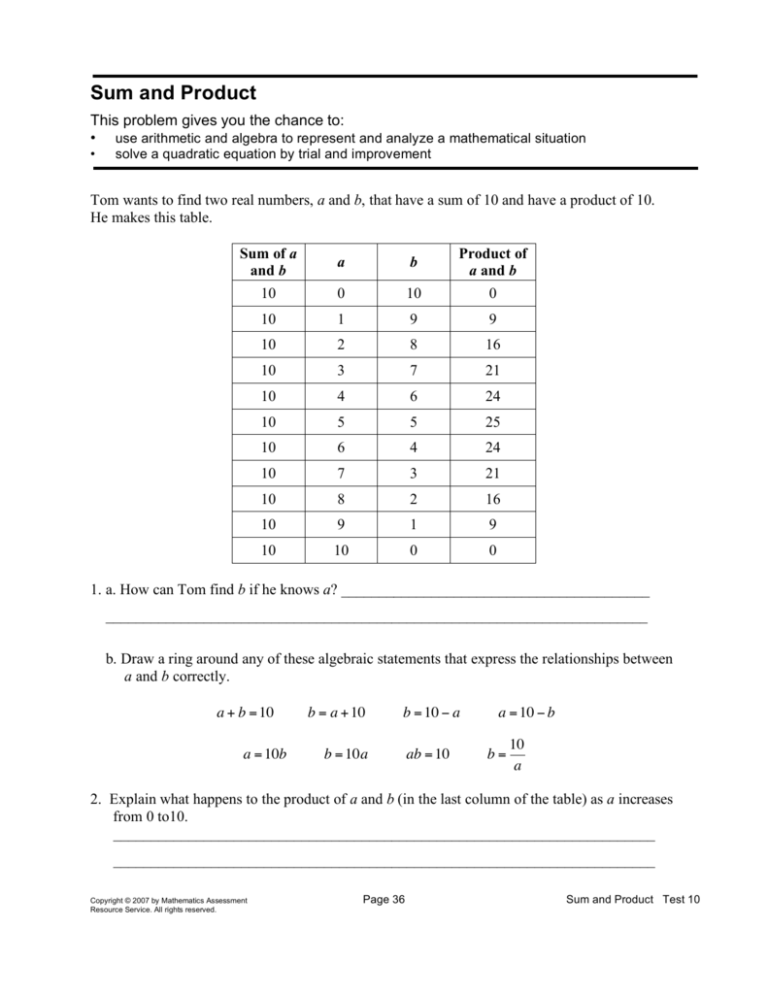
Tom wants to find two real numbers, a and b, that have a sum of 10 and have a product of 10.
He makes this table.
Sum of a
and b
10
a
b
0
10
Product of
a and b
0
10
1
9
9
10
2
8
16
10
3
7
21
10
4
6
24
10
5
5
25
10
6
4
24
10
7
3
21
10
8
2
16
10
9
1
9
10
10
0
0
1. a. How can Tom find b if he knows a? _________________________________________
________________________________________________________________________
b. Draw a ring around any of these algebraic statements that express the relationships between
a and b correctly.
a + b = 10
a = 10b
b = a + 10
b = 10 " a
b = 10a
!
ab = 10
a = 10 " b
b=
10
a
2. Explain what happens to the product of a and b (in the last column of the table) as a increases
from 0 to10.
!
________________________________________________________________________
________________________________________________________________________
Copyright © 2007 by Mathematics Assessment
Resource Service. All rights reserved.
Page 36
Sum and Product Test 10
3. Tom looks at the table and says, “If the product of a and b is 10, a must be somewhere
between 1 and 2 or between 8 and 9.”
a. Explain how the table shows this. __________________________________________
________________________________________________________________________
________________________________________________________________________
b. Tom tries to find the value between 1 and 2. He decides to try a = 1.5 Complete this table to
show his calculations.
Sum of
a and b
a
10
1.5
b
Product of a
and b
c. Which of these two statements is correct? Explain how you decided.
•
a must be between 1 and 1.5
•
a must be between 1.5 and 2
________________________________________________________________________
________________________________________________________________________
________________________________________________________________________
d. Find the values of a and b correct to two decimal places.
_________________
Show your calculations.
8
Copyright © 2007 by Mathematics Assessment
Resource Service. All rights reserved.
Page 37
Sum and Product Test 10
Sum and Product
Rubric
The core elements of performance required by this task are:
• use arithmetic and algebra to represent and analyze a mathematical situation
• solve a quadratic equation by trial and improvement
points
section
points
Based on these, credit for specific aspects of performance should be assigned as follows
1.
a. Gives correct answer: Subtract a from 10 or divide 10 by a.
b.
Draws rings
around
a + b = 10
b = a + 10
a = 10b
b = 10a
b = 10 " a
ab = 10
1
a = 10 " b
b=
10
a
1
!
2.
Gives correct !
explanation such as: The product starts at zero, increases up to
a maximum of 25, then decreases back to zero.
2
1
1
3.a Gives correct explanation such as: The product is less than 10 when a is 1
and more than 10 when a is 2, so a must be between 1 and 2. Similarly for 8
and 9.
1
b
Gives correct answer: 8.5, 12.75
1
c
Gives correct explanation such as: The product is less than 10 when a is 1
and more than 10 when a is 1.5, so a must be between 1 and 1.5
1
d
Gives correct answers: 1.13 and 8.87
1
Shows correct work such as:
1.13 x 8.87 = 10.0231
1.12 x 8.88 = 9.9456
1
5
Total Points
Copyright © 2007 by Mathematics Assessment
Resource Service. All rights reserved.
Page 38
8
Sum and Product Test 10
Sum and Product
Work the task and look at the rubric. What are the key mathematical ideas being assessed in this
task? What do you think students might struggle with?
Look at student work for 1b. How many of your students recognized and circled the
multiplication and division relationships for a and b? Why do you think so many students
struggled with this?
Now look at the explanations in 2, 3a, and 3b. What was missing from students” explanations?
• Did they focus on a and b instead of the product?
• Did they forget to quantify and describe how the pattern changes?
• Did their explanations make sense or did they describe something irrelevant?
• Did they describe a pattern that didn’t fit all the data?
What types of opportunities do students have in your class to make sense of a table of data and
describe trends?
How do you help students understand the qualities and expectations about mathematical
explanations or descriptions?
What kinds of class discussions do students engage in to help them see differences in qualities of
explanations and learn the logic of a mathematically convincing argument?
Look at work for part 3d.
• How many of your students did not attempt this part of the task?
• How many of your students picked values for a and b that did not add to 10?
• How many of your students picked negative values for a or b?
• How many of your students chose numbers with only 1 decimal place?
• How many of your students only tried or showed evidence of one set of values, rather
than testing for closer combination or to check that their solution was optimal?
• How many of your students used their response from the table in 3b?
• How many of your students tried to use algebra to solve for a and b, but got stuck
because they couldn’t factor the expression or didn’t know what to do after they made an
equation?
What are the implications for instruction that you see from looking at this work?
What are the big ideas that students are missing?
Geometry – 2007
Copyright © 2007 by Noyce Foundation
Resource Service. All rights reserved.
39
Looking at Student Work on Sum and Product
Student A is able to write very specific explanations. The student is also able to use algebra to
solve for a and b in part 3d.
Student A
Geometry – 2007
Copyright © 2007 by Noyce Foundation
Resource Service. All rights reserved.
40
Many students attempted to use algebra to solve for a and b, but struggled because they did not
remember the quadratic formula. See the work of Student B.
Student B
Geometry – 2007
Copyright © 2007 by Noyce Foundation
Resource Service. All rights reserved.
41
Student C had difficulty working with decimals. The student subtracted incorrectly in 3b. The
student incorrectly uses a negative sign in the quadratic formula. Student C does not check to
see if the answer makes sense. A brief glance should show that the values do not at to 10 in his
solution to 3d.
Student C
Geometry – 2007
Copyright © 2007 by Noyce Foundation
Resource Service. All rights reserved.
42
Student D notices a pattern in the differences between the products, rather than trying to describe
the products themselves. Do student sin your class get enough opportunities to make
descriptions about trends?
Student D
Many students struggled with the demands in part 3d. Student E only tried one set of numbers
and doesn’t test to see if it can be improved. Student F finds the 2 closest sets of values, but does
not understand decimal place value enough to pick the best choice.
Student E
Student F
Geometry – 2007
Copyright © 2007 by Noyce Foundation
Resource Service. All rights reserved.
43
Geometry
Student Task
Core Idea 3
Algebraic
Properties and
Representations
Task 3
Sum and Product
Use arithmetic and algebra to represent and analyze a mathematical
situation and solve a quadratic equation by trial and improvement.
Represent and analyze mathematical situations and structures
using algebraic symbols.
• Solve equations involving radicals and exponents in
contextualized problems.
Mathematics of the task:
• Ability to read and interpret constraints and make sense of a table of values
• Ability to make mathematical descriptions of information in a table and quantify
relationships
• Understand and use guess and check and/or use the quadratic formula to find an optimal
solution to match the constraints of the task
• Recognize multiple representations of expressions for two sets of constraints to describe
the relationship between two variables
Based on teacher observations, this is what geometry students knew and were able to do:
• Solving for b and finding the product of a and b in part 3b of the task.
• Describing how to find b in part 1a of the task
• Describing why a must be located in a particular place on the number line based on
values in the table in 3a
Areas of difficulty for geometry students:
• Calculating and comparing with decimals
• Identifying algebraic expressions to show the relationship between a and b if their
product is 10
• Describing the trends in the product column of the table
• Explaining why a must be between 1 and 1.5
• Finding the values for a and b to two decimal points
• Solving a quadratic expression that doesn’t factor
Geometry – 2007
Copyright © 2007 by Noyce Foundation
Resource Service. All rights reserved.
44
The maximum score available for this task is 8 points.
The minimum score for a level 3 response, meeting standards, is 4 points.
Most students 94% could fill out the guess and test table for a and the product of a and b in part
3. More than half the students, 62%, could find use division or subtraction to find “a” in part 1,
describe how the product changes as the value of a increases from0 to 10, explain why the
value of b falls between two values on the table, and fill in a guess and test table. 7% of the
students met all the demands of the task including identifying 5 ways to express the relationship
of a and b using both constraints of the problem and calculate values of a and b to two decimal
places to come closest to a product of 10. 6.5% of the students scored no points on this task.
75% of these students attempted the task.
Geometry – 2007
Copyright © 2007 by Noyce Foundation
Resource Service. All rights reserved.
45
Sum and Product
Points
Understandings
75% of the students with this
0
score attempted the task.
1
Students could subtract 1.5 from
10 to solve for b and multiply
with decimals to complete part 3b
of the task.
4
Students with this score could
usually describe the product trend
in 2, explain why a is between
certain values in 3a, fill in the
table in 3b, and describe why the
value of a is located between 1
and 1.5.
5
Students could find the value of b
using algebra, describe the trend
in products, fill in the table, and
describe where a was located.
7
8
Misunderstandings
Students had difficulty using the guess and
test table in 3b. They couldn’t compute
accurately with decimals for find b.
Students struggled with describing the
pattern in the products in the table.
Students did not quantify information,
giving examples such as “a and b cycles,
so the product also cycles”. Some
students gave inaccurate trends, such as
the product is always 0 or the product
always increases. 9% of the students did
not attempt this part of the task.
Many students struggled with describing
how to find a in part 1. 9% said to use a
formula. Some said it’s a pattern. Others
could not express the mathematics using
descriptions reversing the operation, such
as “subtract 10 from a”, or using the
wrong variable, “subtract b from 10”.
Some students used both variables in their
rules, like subtract b from a or multiply a
and b.
Students struggled with finding all the
equivalent expressions in 1b and solving
for a and b to two decimal places. 37% did
not attempt to solve for a and b in 3d.
10% attempted to use algebra, but could
not complete the process using the
quadratic formula.
Students could not find the multiplication
and division expression that met the
constraints for a and b in part 1b of the
task. 70% of all students omitted these
options.
Students could use a guess and
test table to think about the
relationships between two
variables with different
constraints. They could describe
trends and reason about the value
of a that would meet all the
constraints. They could find the
value of a and b to two decimal
places.
Geometry – 2007
Copyright © 2007 by Noyce Foundation
Resource Service. All rights reserved.
46
Implications for Instruction
Students at this grade level should be comfortable doing calculations with decimals. Many
students struggled with subtracting decimal values from 10 to find b. Are there structures in
place in your school geometry program to allow students to “fill in” holes or misconceptions in
their arithmetic skills? Can students drop in and out of remedial or “ramp up: classes to work on
specific topics like decimal calculations, percents, or expressions and equations?
Students at this grade level should understand operations, knowing the inverse relationship
between addition and subtraction and the inverse relationship between multiplication and
division. Students should be able to express these relations in words and symbols. Students
should routinely have opportunities to solve rich tasks which incorporate a variety of current and
past knowledge to solve non-routine problems. Part of the problem-solving repertoire should
involve identifying all the constraints needed in the solution. Another part of the problem-solving
repertoire should include asking themselves questions, such as “is this the optimal solution?”,
“can I get closer?”, “how do I know?” Helping students gain this skill of “self-talk” is important.
Good students seem to have this idea, but making the ideas of self-talk explicit, helps all students
to pick up this strategy.
A great deal of time is devoted in traditional American algebra textbooks to factoring quadratic
expressions to find solutions to the problem. In many European texts, more time is devoted to
going straight to using the quadratic formula, which will work for all cases. This would be a
good topic for discussion in planning for an Algebra Course or to consider when evaluating
Algebra texts. How would this allow more time for other important algebraic topics? What
topics would you like to see developed in more detail?
Geometry – 2007
Copyright © 2007 by Noyce Foundation
Resource Service. All rights reserved.
47

