factors accounting for the decline in the capital adequacy ratio
advertisement
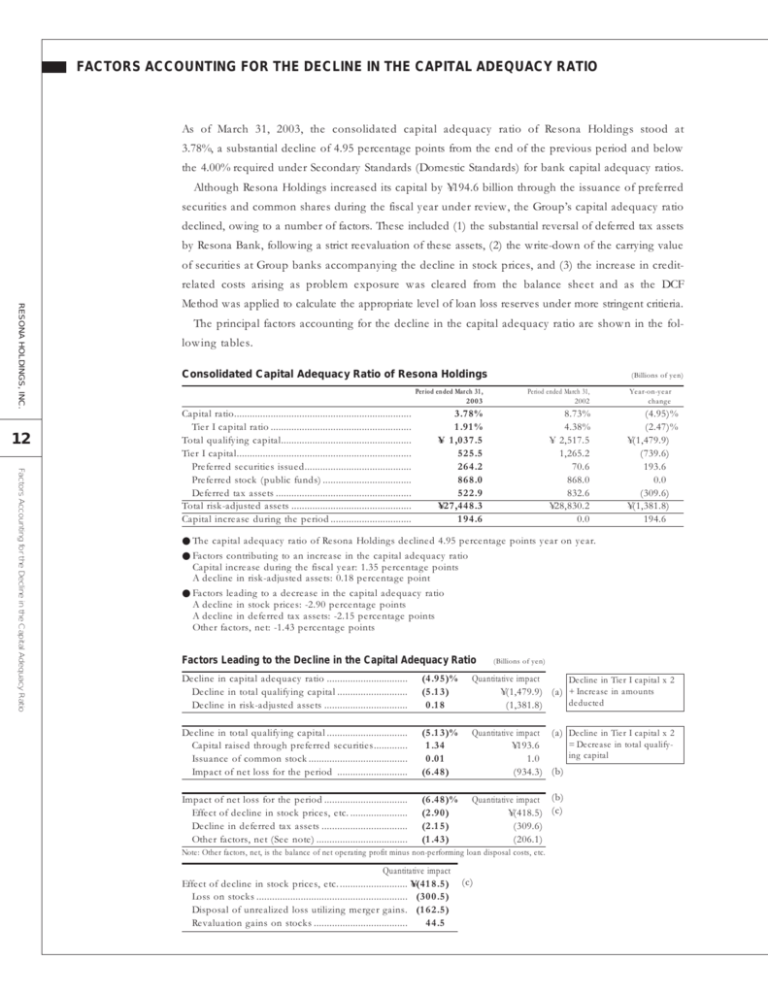
FACTORS ACCOUNTING FOR THE DECLINE IN THE CAPITAL ADEQUACY RATIO As of March 31, 2003, the consolidated capital adequacy ratio of Resona Holdings stood at 3.78%, a substantial decline of 4.95 percentage points from the end of the previous period and below the 4.00% required under Secondary Standards (Domestic Standards) for bank capital adequacy ratios. Although Resona Holdings increased its capital by ¥194.6 billion through the issuance of preferred securities and common shares during the fiscal year under review, the Group’s capital adequacy ratio declined, owing to a number of factors. These included (1) the substantial reversal of deferred tax assets by Resona Bank, following a strict reevaluation of these assets, (2) the write-down of the carrying value of securities at Group banks accompanying the decline in stock prices, and (3) the increase in creditrelated costs arising as problem exposure was cleared from the balance sheet and as the DCF RESONA HOLDINGS, INC. 12 Method was applied to calculate the appropriate level of loan loss reserves under more stringent critieria. The principal factors accounting for the decline in the capital adequacy ratio are shown in the following tables. Consolidated Capital Adequacy Ratio of Resona Holdings Factors Accounting for the Decline in the Capital Adequacy Ratio Capital ratio.................................................................... Tier I capital ratio ...................................................... Total qualifying capital.................................................. Tier I capital................................................................... Preferred securities issued......................................... Preferred stock (public funds) .................................. Deferred tax assets .................................................... Total risk-adjusted assets .............................................. Capital increase during the period ............................... (Billions of yen) Period ended March 31, 2003 Period ended March 31, 2002 3.78% 1.91% ¥01,037.5 525.5 264.2 868.0 522.9 ¥27,448.3 194.6 8.73% 4.38% ¥02,517.5 1,265.2 70.6 868.0 832.6 ¥28,830.2 0.0 Year-on-year change (4.95)% (2.47)% ¥(1,479.9) (739.6) 193.6 0.0 (309.6) ¥(1,381.8) 194.6 ● The capital adequacy ratio of Resona Holdings declined 4.95 percentage points year on year. ● Factors contributing to an increase in the capital adequacy ratio Capital increase during the fiscal year: 1.35 percentage points A decline in risk-adjusted assets: 0.18 percentage point ● Factors leading to a decrease in the capital adequacy ratio A decline in stock prices: -2.90 percentage points A decline in deferred tax assets: -2.15 percentage points Other factors, net: -1.43 percentage points Factors Leading to the Decline in the Capital Adequacy Ratio (Billions of yen) Decline in capital adequacy ratio ............................... Decline in total qualifying capital ........................... Decline in risk-adjusted assets ................................ (4.95)% (5.13) 0.18 Quantitative impact Decline in Tier I capital x 2 ¥(1,479.9) (a) + Increase in amounts deducted (1,381.8) Decline in total qualifying capital ............................... Capital raised through preferred securities............. Issuance of common stock ...................................... Impact of net loss for the period ........................... (5.13)% 1.34 0.01 (6.48) Quantitative impact (a) Decline in Tier I capital x 2 = Decrease in total qualify¥193.6 ing capital 1.0 (934.3) (b) Impact of net loss for the period ................................ Effect of decline in stock prices, etc. ...................... Decline in deferred tax assets ................................. Other factors, net (See note) ................................... (6.48)% (2.90) (2.15) (1.43) Quantitative impact (b) ¥(418.5) (c) (309.6) (206.1) Note: Other factors, net, is the balance of net operating profit minus non-performing loan disposal costs, etc. Quantitative impact Effect of decline in stock prices, etc. .......................... ¥(418.5) Loss on stocks .......................................................... (300.5) Disposal of unrealized loss utilizing merger gains. (162.5) Revaluation gains on stocks .................................... 44.5 (c)
