Analysis and Classification of EEG Signals Related to Arithmetic
advertisement
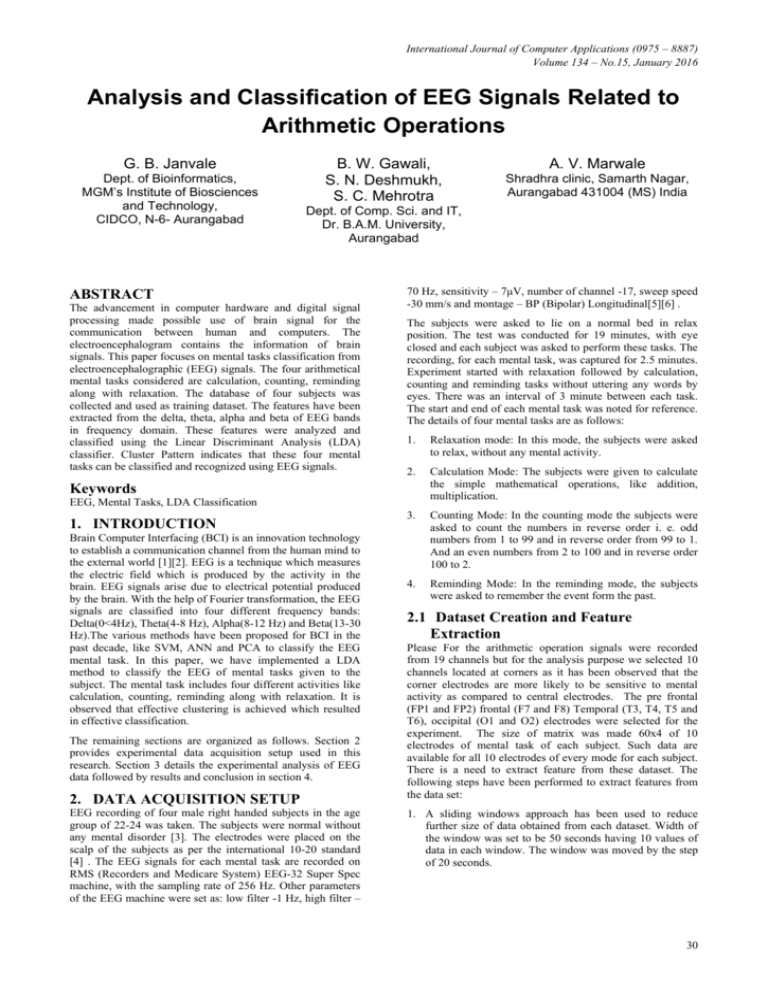
International Journal of Computer Applications (0975 – 8887) Volume 134 – No.15, January 2016 Analysis and Classification of EEG Signals Related to Arithmetic Operations G. B. Janvale Dept. of Bioinformatics, MGM’s Institute of Biosciences and Technology, CIDCO, N-6- Aurangabad B. W. Gawali, S. N. Deshmukh, S. C. Mehrotra A. V. Marwale Shradhra clinic, Samarth Nagar, Aurangabad 431004 (MS) India Dept. of Comp. Sci. and IT, Dr. B.A.M. University, Aurangabad ABSTRACT The advancement in computer hardware and digital signal processing made possible use of brain signal for the communication between human and computers. The electroencephalogram contains the information of brain signals. This paper focuses on mental tasks classification from electroencephalographic (EEG) signals. The four arithmetical mental tasks considered are calculation, counting, reminding along with relaxation. The database of four subjects was collected and used as training dataset. The features have been extracted from the delta, theta, alpha and beta of EEG bands in frequency domain. These features were analyzed and classified using the Linear Discriminant Analysis (LDA) classifier. Cluster Pattern indicates that these four mental tasks can be classified and recognized using EEG signals. 70 Hz, sensitivity – 7μV, number of channel -17, sweep speed -30 mm/s and montage – BP (Bipolar) Longitudinal[5][6] . The subjects were asked to lie on a normal bed in relax position. The test was conducted for 19 minutes, with eye closed and each subject was asked to perform these tasks. The recording, for each mental task, was captured for 2.5 minutes. Experiment started with relaxation followed by calculation, counting and reminding tasks without uttering any words by eyes. There was an interval of 3 minute between each task. The start and end of each mental task was noted for reference. The details of four mental tasks are as follows: 1. Relaxation mode: In this mode, the subjects were asked to relax, without any mental activity. 2. Calculation Mode: The subjects were given to calculate the simple mathematical operations, like addition, multiplication. 3. Counting Mode: In the counting mode the subjects were asked to count the numbers in reverse order i. e. odd numbers from 1 to 99 and in reverse order from 99 to 1. And an even numbers from 2 to 100 and in reverse order 100 to 2. 4. Reminding Mode: In the reminding mode, the subjects were asked to remember the event form the past. Keywords EEG, Mental Tasks, LDA Classification 1. INTRODUCTION Brain Computer Interfacing (BCI) is an innovation technology to establish a communication channel from the human mind to the external world [1][2]. EEG is a technique which measures the electric field which is produced by the activity in the brain. EEG signals arise due to electrical potential produced by the brain. With the help of Fourier transformation, the EEG signals are classified into four different frequency bands: Delta(0<4Hz), Theta(4-8 Hz), Alpha(8-12 Hz) and Beta(13-30 Hz).The various methods have been proposed for BCI in the past decade, like SVM, ANN and PCA to classify the EEG mental task. In this paper, we have implemented a LDA method to classify the EEG of mental tasks given to the subject. The mental task includes four different activities like calculation, counting, reminding along with relaxation. It is observed that effective clustering is achieved which resulted in effective classification. The remaining sections are organized as follows. Section 2 provides experimental data acquisition setup used in this research. Section 3 details the experimental analysis of EEG data followed by results and conclusion in section 4. 2. DATA ACQUISITION SETUP EEG recording of four male right handed subjects in the age group of 22-24 was taken. The subjects were normal without any mental disorder [3]. The electrodes were placed on the scalp of the subjects as per the international 10-20 standard [4] . The EEG signals for each mental task are recorded on RMS (Recorders and Medicare System) EEG-32 Super Spec machine, with the sampling rate of 256 Hz. Other parameters of the EEG machine were set as: low filter -1 Hz, high filter – 2.1 Dataset Creation and Feature Extraction Please For the arithmetic operation signals were recorded from 19 channels but for the analysis purpose we selected 10 channels located at corners as it has been observed that the corner electrodes are more likely to be sensitive to mental activity as compared to central electrodes. The pre frontal (FP1 and FP2) frontal (F7 and F8) Temporal (T3, T4, T5 and T6), occipital (O1 and O2) electrodes were selected for the experiment. The size of matrix was made 60x4 of 10 electrodes of mental task of each subject. Such data are available for all 10 electrodes of every mode for each subject. There is a need to extract feature from these dataset. The following steps have been performed to extract features from the data set: 1. A sliding windows approach has been used to reduce further size of data obtained from each dataset. Width of the window was set to be 50 seconds having 10 values of data in each window. The window was moved by the step of 20 seconds. 30 International Journal of Computer Applications (0975 – 8887) Volume 134 – No.15, January 2016 2. Mean, Variance, Standard Deviation, and Coefficient of variation were computed for each window for all mental tasks. S1 0.0030 0.0068 0.0054 0.0101 S2 0.0041 0.0066 0.0056 0.0039 3. These normalized values have been taken as feature vector for a given subject in a given mental task. S3 0.0058 0.0045 0.0054 0.0052 S4 0.0050 0.0052 0.0078 0.0052 Average 0.0045 0.0058 0.0060 0.0061 2.2 Analysis and Classification The feature vectors have been provided for the classification and clustering purpose. It is possible to create appropriate different classes of dataset. The four separate classes of dataset have been created according to four different frequency components (delta, theta, alpha, and beta) including all different modes (relaxation, calculation, counting, and reminding modes). The linear discriminant analysis (Fishers Algorithm) [7] has been implemented on class-within class matrix datasets. The aim of LDA is to use hyper- planes to separate the data representing the different classes. For the classification and clustering purpose, we have created appropriate different classes of dataset. The Fig. 1 shows the clustering patterns obtained for four types of activities from four frequency bands. The cluster properties like their radii and the distances between clusters, the mental tasks are relaxation (Rel), calculation (Ca), counting (Co), and Reminder (Re) as well as subject1, (S1), subject2 (S2), subject3 (S3), and subject (S4) are given in Table 1. Table 1. Average values of differences in distance related to each cluster and their radii 3. RESULT AND DISCUSSION The property of given cluster pattern can be measured by the mean radius of each cluster and distance between different clusters. The smaller value of mean radius and grater values of distance between two clusters will indicate good quality cluster to recognize objects in different classes better. No overlapping between two clusters will indicate no confusion in classification of objects. The average radius and distance between two clusters have been determined. It has been seen from the Table 1 that the maximum distance (1.03) is between relaxation and counting, whereas the minimum distance (0.62) is found between counting and reminding. The minimum mean radius (0.0030) is corresponding to relaxation state, while, maximum value of (0.0101) is for reminding state. Figure 1 (a, b, c, and d) depicts the clustering and sensitivity of relaxation, calculation, counting, and reminding modes for delta, theta, alpha, and beta frequencies for all ten electrodes respectively. Average distance in each cluster Tasks Rel Ca Co Rem Rel 0 0.75 1.03 0.99 0 0.68 0.86 0 0.62 Ca Co 0 Re Average distance of radii of clusters 0.8 0.6 Relaxation Mode Calculation Mode Counting Mode Reminding Mode 0.4 0.6 0.4 Relaxation Mode Calculation Mode Counting Mode Reminding Mode 0.2 0.2 0 0 -0.2 -0.2 -0.4 -0.4 -0.6 -0.6 -0.8 -0.8 -0.8 -0.4 -0.2 0 0.2 0.4 0.6 (a) Delta frequency 0.8 -0.6 -0.4 -0.2 0 0.2 0.4 0.6 1 (b) Theta frequency 31 International Journal of Computer Applications (0975 – 8887) Volume 134 – No.15, January 2016 0.3 0.4 0.3 0.2 Relaxation Mode Calculation Mode Counting Mode Reminding Mode Relaxation Mode Calculation Mode Counting Mode Reminding Mode 0.2 0.1 0.1 0 0 -0.1 -0.1 -0.2 -0.2 -0.3 -0.3 -0.4 -0.4 -0.5 -0.6 -2 -1.5 -1 -0.5 0 0.5 1 (c) Alpha frequency -0.5 -0.3 -0.2 -0.1 0 0.1 0.2 0.3 0.4 0.5 0.6 (d) Beta frequency Fig 1: The clustering for each group for each frequency of a subject (a) Delta frequency, (b) Theta frequency (c) Alpha frequency, and (d) Beta frequency. 4. CONCLUSION We have described different tasks analyzing the EEG signals. The data acquisition was done on four subjects. In this experiment, the subjects were given mental tasks i.e. relaxation, calculation, counting and reminding. The LDA method was used for classification of EEG signals. It has been found that the LDA technique works well and it is possible to recognize the mental activities by corresponding EEG. 5. ACKNOWLEDGMENTS This work was supported by University Grand Commission (UGC), New Delhi as a major research project. The authors would also like to thank to the department of computer science and information technology, Dr. Babasaheb Ambedkar Marathwada University, Aurangabad to provide the laboratory to conduct the experiments and to al 4 subjects who participated in the experiments. 6. REFERENCES [1] S. Sanei and J. A. Chamber. 2007 EEG Signal Processing. John Wiley and Son, Lit. [2] J. R. Wolpaw, N. Birbaumer, D. J. McFaland, G. Pfurtscheller, and T. M. Vaughan (2002) .Bain Computer Interfaces for Communication and Control. Clinical Neurophys., 767-791. IJCATM : www.ijcaonline.org [3] S. Koelstra, C. Muhl, M. Soleymani, J-S.Lee, A. Yazdani, T. Ebrahimi, T. Pun, A. Nijholt, and I. Patra. 2012 DEAP: A Database for Emotional Analysis using Physiological Signals. IEEE Transaction on Affective Computing, 18-31. [4] H. Jasper. (1958) Reports on the Committee on Methods of Clinical Examination in Electroencephalograph. Clinical Neurophysiology, 370-375, 1958. [5] B. W. Gawali, P. B. Rokade, G. B. Janvale, and S. C. Mehrotra. (2010) Ovarian Hormones and Brain Signals Annals of Neurosciences, 72-74. [6] G. B. Janvale, B. W. Gawali, R. S. Deore, S. N. Deshmukh, S. C. Mehrotra, and A.V. Marwale (2010) Song Induced Mood Recognition System using EEG Signals. Annals of Neurosciences, 80-84, 2010. [7] G. B. Janvale, Sanjeev Kendre, and Suresh Mehrotra, (2014) “Mental and Behavioural Disorders Related to Alcohol and their Effects on EEG Signals – An Overview”, Procedia - Social and Behavioral Sciences, Volume 133, 15 May 2014, Pages 116–121 [8] Y. Jian, T. Zhong, Y. Jing-yu, Z. David, and A. Frungi.(2004) Essence of Kernel Fisher Discriminant: KPCA plus LDA. The Journal of the Computer Recognition Society, Elsevier Computer.2097-2100. 32
