Elementary Statistics - Chapter 3 Test Review Key
advertisement

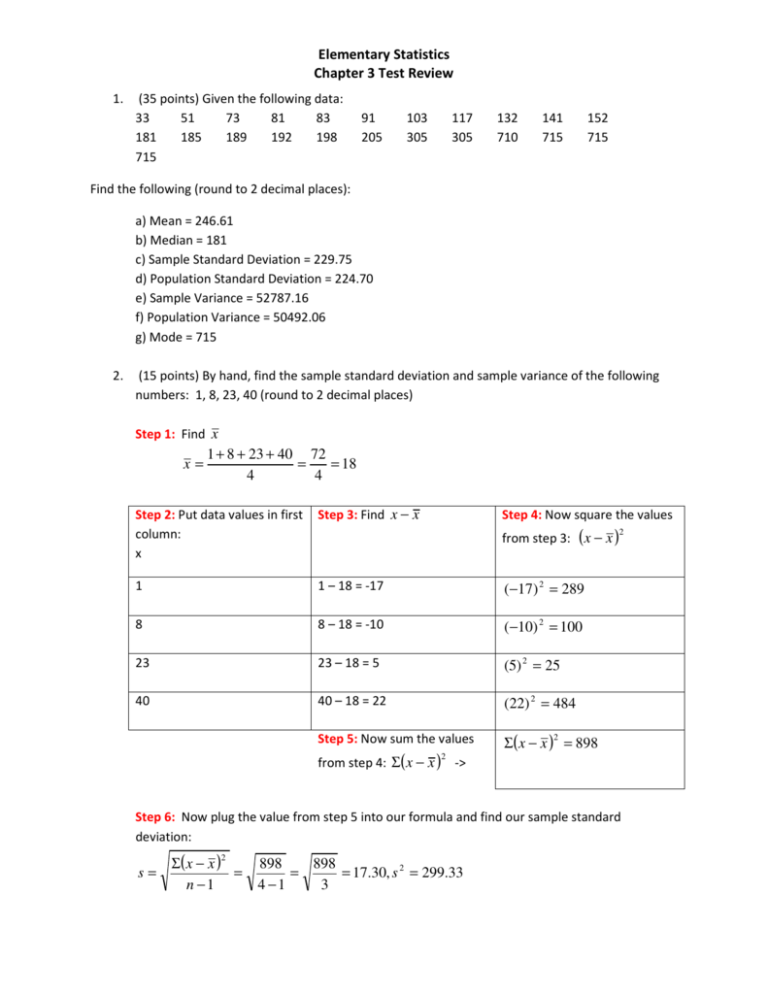
Elementary Statistics Chapter 3 Test Review 1. (35 points) Given the following data: 33 51 73 81 83 181 185 189 192 198 715 91 205 103 305 117 305 132 710 141 715 152 715 Find the following (round to 2 decimal places): a) Mean = 246.61 b) Median = 181 c) Sample Standard Deviation = 229.75 d) Population Standard Deviation = 224.70 e) Sample Variance = 52787.16 f) Population Variance = 50492.06 g) Mode = 715 2. (15 points) By hand, find the sample standard deviation and sample variance of the following numbers: 1, 8, 23, 40 (round to 2 decimal places) Step 1: Find x x= 1 + 8 + 23 + 40 72 = = 18 4 4 Step 2: Put data values in first column: x Step 3: Find x − x 1 1 – 18 = -17 (−17) 2 = 289 8 8 – 18 = -10 (−10) 2 = 100 23 23 – 18 = 5 (5) 2 = 25 40 40 – 18 = 22 (22) 2 = 484 Step 5: Now sum the values Σ( x − x ) = 898 Step 4: Now square the values from step 3: ( x − x ) 2 2 2 from step 4: Σ( x − x ) -> Step 6: Now plug the value from step 5 into our formula and find our sample standard deviation: 2 s= Σ( x − x ) = n −1 898 898 = = 17.30, s 2 = 299.33 4 −1 3 Elementary Statistics Chapter 3 Test Review 3. (10 points) The weight, in grams, of the pair of kidneys in adult males between the ages of 40 and 49 has a bell-shaped distribution with a mean of 300 grams and a standard deviation of 25 grams. a. About 95% of kidney pairs will be between what weights? b. What percentage of kidney pairs weighs between 275 and 375? c. What percentage of kidney pairs weighs less than 225 and more than 350? d. What percentage of kidney pairs weighs between 250 and 325? Build the table below: a) 250 – 350 b) 34% + 34% + 13.5% + 2.35% = 83.85% c) 0.15% + 2.35% + 0.15% = 2.65% d) 13.5% + 34% + 34% = 81.5% Elementary Statistics Chapter 3 Test Review 4. (10 points) Given the following distribution: Ages Freq 10-29 15 30-49 5 50-69 23 70-89 35 Find the sample mean and sample standard deviation (round to 2 decimal places) We need our midpoints (take the LCL of the first class and add the LCL of the second class, then use class width to get the rest): Midpoints Freq 20 15 40 5 60 23 80 35 x = 60, s = 22.79 5. (5 points) Determine which student scored higher relative to their particular class. Janet got 80 and her class’ mean was 73 with a standard deviation of 5. Sally got 82 and her class’ mean was 77 with a standard deviation of 7. (Show all work to justify your answer) Janet z= Sally x−µ σ 80 − 73 5 z = 1 .4 z= Janet scored higher because her z-score is higher z= x−µ σ 82 − 77 7 z = 0.71 z= Elementary Statistics Chapter 3 Test Review 6. (10 points) Given the following data: 33 51 72 81 305 417 505 567 82 601 91 902 93 1014 a) Find the percentile of 567 13 ⋅ 100 = 76th 17 b) Find the percentile of 91 5 ⋅ 100 = 29th 17 c) Find P30 k i= (n + 1) 100 30 i= (17 + 1) 100 i = 5 .4 So we are going to average the 5th and 6th value: 82 + 91 = 86.5 2 d) Find P17 k i= (n + 1) 100 17 i= (17 + 1) 100 i = 3.06 So we are going to average the 3rd and 4th value: 72 + 81 = 76.5 2 97 101 210 Elementary Statistics Chapter 3 Test Review 7. (5 points) Given the following data: 5 11 22 23 27 31 45 85 92 a) Find the 5-number summary b) Draw the box plot c) Determine if the data is skewed right, skewed left, or symmetric. a) 5, 22, 31, 92, 210 b) c) skewed right 105 210 Elementary Statistics Chapter 3 Test Review 8. (10 Points) Given the following population data: 3 25 27 31 35 41 53 72 85 91 103 107 110 111 112 230 405 713 815 821 822 1505 a) Compute the z-score corresponding to 35 z= x−µ σ = 35 − 287.1363636 = −0.65 386.015814 b) Determine the quartiles Q1 = 41, Q2 = 105, Q3 = 405 c) Compute the interquartile range (IQR) IQR = Q3 − Q1 = 405 − 41 = 364 d) Determine the lower and upper fences, are there any outliers? LF = Q1 − 1.5( IQR) = 41 − 1.5(364) = −505 UF = Q3 + 1.5( IQR) = 405 + 1.5(364) = 951 1505 is an outlier since it is greater than our upper fence (UF)


