Power Spectra Tests - Wayne Hu`s Tutorials
advertisement
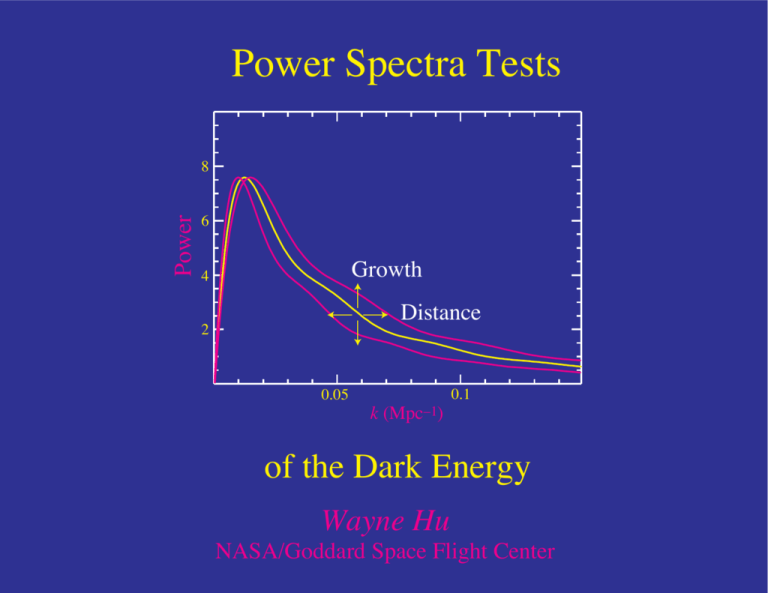
Power Spectra Tests 8 Power 6 Growth 4 Distance 2 0.05 k (Mpc–1) 0.1 of the Dark Energy Wayne Hu NASA/Goddard Space Flight Center Outline Power spectrum tests of the dark energy in light of the CMB From crude to precision measurements • Variance of cluster counts in cells • Angular power spectra • 3D power spectra with δz < 0.01 Collaborators: • Zoltan Haiman • Bhuvnesh Jain • Andrey Kravtsov • Marcos Lima Dark Energy Sensitivity • • Growth: G=(growth rate)/a; normalized to high z Distances: D=comoving distance; D*=to recombination 1 0.8 G 0.6 0.4 D/D* 0.2 0 1 2 z 3 4 5 Dark Energy Sensitivity • • • Growth: G=(growth rate)/a; normalized to high z Distances: D=comoving distance; D*=to recombination Sensitivity to wDE: comparable 0 ∆G/G -0.05 ∆D/D -0.1 -0.15 0 ∆wDE=1/3 1 2 z 3 4 5 Initial Power Spectrum • • Initial power spectrum on scales relevant for clusters determined by CMB Improvement goes with the reionization optical depth τ 1 10-1 10-2 ∆m2(k,z=3) e-2τ 10-3 10-4 σ8 10-5 0.001 WMAPext; M. White 0.01 k (Mpc-1) 0.1 1 σ8 • Determination of the normalization during the acceleration epoch, even σ8 , measures the dark energy with negligible uncertainty from other parameters • Approximate scaling (flat, negligible neutrinos: σ8 2 −1/3 Ωb h δζ ≈ 5.6 × 10⁻⁵ 0.024 0.693 G0 h , × 0.76 0.72 2 Ωm h 0.14 Hu & Jain 2003) 0.563 (3.12h)(n−1)/2 • δζ , Ωb h2 , Ωm h2 , n all well determined; eventually to ∼ 1% precision p • h = Ωm h2 /Ωm ∝ (1 − ΩDE )−1/2 measures dark energy density • G0 measures dark energy dependent growth rate Cluster Abundance • • Power spectrum controls halo abundance; exponential sensitivity above M*; σ(M*)=1 Abundance evolution determines dark energy evolution 10 1 0.1 M * dnh ρ 0 d ln Mh 0.01 M* 0.001 1011 1012 Mh 1013 1014 (h-1M ) 1015 Idealized Constraints • • Fixed high-z power inverts redshift trends and eliminates σ8 as parameter Sampling errors neither dominant nor negligible -0.8 Evolution fixed wDE -0.85 -0.9 -0.95 4000 deg2 Mth=1014.2 h-1 M 1% CMB Priors 0.6 0.65 Hu & Kravtsov (2002) [Haiman et al 2001] 0.7 ΩDE 0.75 0.8 Sample Variance • • Cluster mass halos are rare, strongly clustered Sample variance increases noise on abundance but also provides a handle on the mass threshold 10 b(Mh) 1 0.1 M * dnh ρ 0 d ln Mh 0.01 M* 0.001 1011 1012 Mh 1013 1014 (h-1M ) 1015 Mass-Observable Relation • • Relationship between halos of given mass and observables sets mass threshold and scatter around threshold Clusters largely avoid N(Mh) problem with multiple objects in halo 10 1 0.1 σlnM M * dnh ρ 0 d ln Mh ms As Mth N(Mh) 0.01 z=0 0.001 1011 1012 Mh 1013 1014 (h-1M ) 1015 Mass-Observable Evolution Jointly fitting an unknown normalization and power law evolution degrades constraints (Levine et al 2003; Hu 2003; Majumdar & Mohr 2003) -0.8 Evolution fixed -0.85 wDE • Evolution marginalized -0.9 -0.95 4000 deg2 Mth=1014.2 h-1 M 1% CMB Priors 0.6 0.65 0.7 ΩDE 0.75 0.8 Mass-Observable Evolution • • (Sampling) noise is signal! Excess variance of counts in cells measures mass-dependent bias in clustering (requires only photometric redshifts ∆z~0.1) -0.8 Evolution fixed wDE -0.85 Evolution marginalized Sample variance info -0.9 -0.95 400 10 deg2 cells Mth=1014.2 h-1 M 1% CMB Priors 0.6 Lima & Hu (2004) 0.65 0.7 ΩDE 0.75 0.8 Angular Power Spectrum • • Match mass threshold to counts for given cosmology Angular power spectra including cluster weak lensing (cluster mass correlation) gives dark energy -0.8 distance (efficiency ratio) wDE -0.85 -0.9 joint angular power spectra -0.95 Hu & Jain (2003) 0.6 0.65 0.7 ΩDE 0.75 0.8 4000 deg2 l<3000 Mth=1014.2 h-1 M 1% CMB Priors Standard Rulers • CMB peaks provide standard ruler for distance measures to recombination and potentially lower redshifts: sound horizon and particle horizon at equality imprinted in transfer function Angular Scale 90 6000 2 0.5 0.2 TT Cross Power Spectrum l(l+1)C l /2π (µK2 ) 5000 Model WMAP CBI ACBAR 4000 3000 2000 1000 0 0 10 40 100 200 400 Multipole moment (l) WMAP: Bennett et al (2003) 800 1400 Dark Energy Sensitivity • • • Angular diameter distance to recombination fixed to 4% Follow degeneracy line in wDE, ΩDE for flat universe Sensitivity to wDE changes: 0.1 ∆D/D 0 ∆G/G -0.1 0 ∆wDE=1/3 1 2 z 3 4 5 • • Local Test: H0 Locally DA = ∆z/H0, and the observed power spectrum is isotropic in h Mpc-1 space Template matching the features yields the Hubble constant CMB provided 8 Observed h Mpc-1 Power 6 4 h 2 0.05 Eisenstein, Hu & Tegmark (1998) k (Mpc–1) 0.1 Cosmological Distances • Modes perpendicular to line of sight measure angular diameter distance CMB provided 8 Observed l DA-1 Power 6 4 2 DA 0.05 Cooray, Hu, Huterer, Joffre (2001) k (Mpc–1) 0.1 Acoustic Rings • Baryon oscillations appear as rings in a 2D power spectrum with modes parallel and perpedicular to the line of sight 0.14 k (Mpc-1) 0.12 0.10 0.08 0.06 0.04 ~10% peak to trough 0.02 0.02 0.04 0.06 0.08 0.10 0.12 0.14 -1) (Mpc k ⊥ Seo &Eisenstein (2003); Blake & Glazenbrook (2003) D(z) and H(z) • Galaxy survey similar to SDSS Main + LRG; cluster survey similar to SPT but with redshift followup 1.2 (a) Angular DA-1 (b) Radial H shift 1.1 1.0 0.9 0.8 w=-1 w=-1 w=-2/3 w=-2/3 clusters galaxies 0.1 Hu & Haiman (2003) clusters galaxies z 1 0.1 z 1 Dark Energy • Even marginalizing bias evolution b(z) and redshift space distortions β, dark energy constraints possible with a reasonable extrapolation from current CMB power spectrum priors w -0.9 -0.95 Galaxies -1 Hu & Haiman (2003) Clusters 0.7 0.72 ΩDE 0.74 Summary • Amplitude and shape of the power spectrum known precisely from the CMB at high z and will continue to improve • Determination of amplitude (σ8 ) or distance (H0 ) at z = 0 measures well defined dark energy parameters • Intermediate redshifts probe the dark energy evolution • Cluster abundance for known mass-observable relation • Variance of counts in cells to calibrate mass-observable relation • Angular power spectra at fixed counts • 3D power spectra to measure D(z) and H(z)
