Gouritz
advertisement
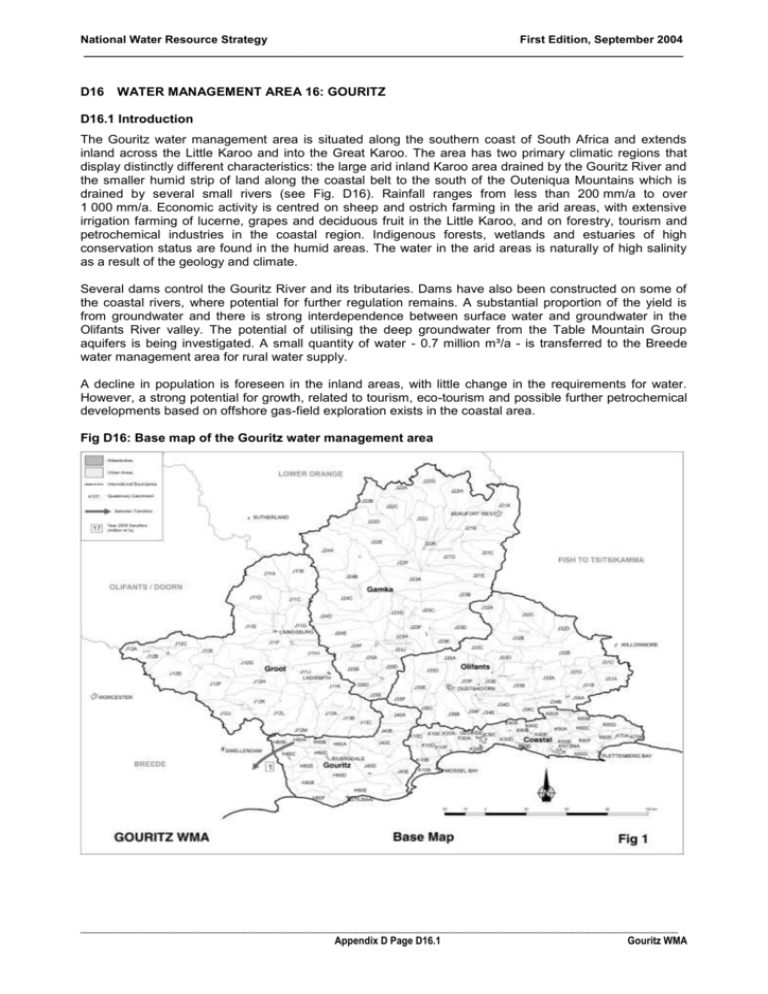
National Water Resource Strategy First Edition, September 2004 _____________________________________________________________________________________________ D16 WATER MANAGEMENT AREA 16: GOURITZ D16.1 Introduction The Gouritz water management area is situated along the southern coast of South Africa and extends inland across the Little Karoo and into the Great Karoo. The area has two primary climatic regions that display distinctly different characteristics: the large arid inland Karoo area drained by the Gouritz River and the smaller humid strip of land along the coastal belt to the south of the Outeniqua Mountains which is drained by several small rivers (see Fig. D16). Rainfall ranges from less than 200 mm/a to over 1 000 mm/a. Economic activity is centred on sheep and ostrich farming in the arid areas, with extensive irrigation farming of lucerne, grapes and deciduous fruit in the Little Karoo, and on forestry, tourism and petrochemical industries in the coastal region. Indigenous forests, wetlands and estuaries of high conservation status are found in the humid areas. The water in the arid areas is naturally of high salinity as a result of the geology and climate. Several dams control the Gouritz River and its tributaries. Dams have also been constructed on some of the coastal rivers, where potential for further regulation remains. A substantial proportion of the yield is from groundwater and there is strong interdependence between surface water and groundwater in the Olifants River valley. The potential of utilising the deep groundwater from the Table Mountain Group aquifers is being investigated. A small quantity of water - 0.7 million m³/a - is transferred to the Breede water management area for rural water supply. A decline in population is foreseen in the inland areas, with little change in the requirements for water. However, a strong potential for growth, related to tourism, eco-tourism and possible further petrochemical developments based on offshore gas-field exploration exists in the coastal area. Fig D16: Base map of the Gouritz water management area _________________________________________________________________________________________________________________ Appendix D Page D16.1 Gouritz WMA National Water Resource Strategy First Edition, September 2004 _____________________________________________________________________________________________ D16.2 Key statistics relevant to the Gouritz water management area Tables D16.1 to D16.6 contain a breakdown of the information given in Tables 2.1 to 2.6 of Chapter 2 for each sub-area of the Gouritz water management area. Data is derived primarily from the standardised database. Different information may be available from other sources. Table D16.1: Natural mean annual runoff (MAR) and ecological Reserve (million m³/a) Component/ Sub-area Ecological Reserve1, 2 Natural MAR1 Gamka 227 19 Groot 105 5 Olifants 229 17 Gouritz 347 56 Coastal Total for WMA 771 228 1 679 325 1) Quantities are incremental and refer to the sub-area under consideration only. 2) The total volume is based on preliminary estimates, with impact on yield being a portion of this. Table D16.2: Available yield in the year 2000 (million m³/a) Natural resource Component/ Sub-area Surface water1 Usable return flow Groundwater Irrigation Urban Mining and bulk Total local yield Gamka 24 24 0 0 0 48 Groot 19 23 0 0 0 42 Olifants 49 15 3 4 0 71 Gouritz 54 1 3 1 0 59 Coastal Total for WMA 45 1 2 1 6 55 191 64 8 6 6 275 1) After allowance for the impacts on yield of the ecological component of the Reserve, river losses, alien vegetation, rain-fed sugar cane and urban runoff. _________________________________________________________________________________________________________________ Appendix D Page D16.2 Gouritz WMA National Water Resource Strategy First Edition, September 2004 _____________________________________________________________________________________________ Table D16.3: Water requirements for the year 2000 (million m³/a) Sector/ Sub-area Urban1 Irrigation Mining and bulk industrial2 Rural1 AfforesPower generation3 tation4 Total local requirements Gamka 49 5 1 0 0 0 55 Groot 49 2 2 0 0 0 53 Olifants 62 10 2 0 0 0 74 Gouritz 51 3 3 0 0 1 58 Coastal Total for WMA 43 32 3 6 0 14 98 254 52 11 6 0 15 337 1) Includes component of Reserve for basic human needs at 25 ℓ/c/d. 2) Mining and bulk industrial water uses that are not part of urban systems. 3) Includes water for thermal power generation only. (Water for hydropower, which represents a small portion of power generation in South Africa, is generally available for other uses as well.) 4) Quantities refer to the impact on yield only. Table D16.4: Reconciliation of water requirements and availability for the year 2000 (million m³/a) Component/ Sub-area Local yield Transfers in2 Local requirements Transfers out2 Balance1 Gamka 48 0 55 0 ( 7) Groot 42 0 53 0 ( 11) Olifants 71 0 74 0 ( 3) Gouritz 59 0 58 1 0 Coastal Total for WMA 55 0 98 0 ( 43) 275 0 338 1 ( 64) 1) Brackets around numbers indicate a negative balance. Surpluses are shown in the most upstream subarea where they first become available. 2) Transfers into and out of sub-areas may include transfers between sub-areas as well as transfers between WMAs. The addition of the quantities transferred per sub-area does therefore not necessarily correspond to the total transfers into and out of the WMA. The same applies to Tables D16.5 and D16.6. _________________________________________________________________________________________________________________ Appendix D Page D16.3 Gouritz WMA National Water Resource Strategy First Edition, September 2004 _____________________________________________________________________________________________ Table D16.5: Reconciliation of water requirements and availability for the year 2025 base scenario (million m³/a) Component/ Sub-area Local yield1 Transfers in Local requirements2 Transfers out Balance3 Potential for development4 Gamka 48 0 55 0 ( 7) 0 Groot 43 0 52 0 ( 9) 0 Olifants 71 0 75 0 ( 4) 0 Gouritz 60 0 58 1 1 Coastal Total for WMA 56 0 116 0 ( 60) 10 100 278 0 356 1 ( 79) 110 1) Based on existing infrastructure and infrastructure under construction in the year 2000. Also includes return flows resulting from a growth in requirements. 2) Based on a growth in water requirements as a result of population growth and general economic development. Assumes no general increase in irrigation. 3) Brackets around numbers indicate a negative balance. 4) Provisional estimates, subject to detailed investigations of environmental impacts and feasibility of developments. Table D16.6: Reconciliation of water requirements and availability for the year 2025 high scenario (million m³/a) Component/ Sub-area Local yield1 Transfers in Local requirements2 Transfers out Balance3 Potential for development4 Gamka 48 0 60 0 ( 12) 0 Groot 43 0 53 0 ( 10) 0 Olifants 78 0 90 0 ( 12) 0 Gouritz 61 0 61 1 ( 1) Coastal Total for WMA 58 0 181 0 ( 123) 10 100 288 0 445 1 ( 158) 110 1) Based on existing infrastructure and infrastructure under construction in the year 2000. Also includes return flows resulting from a growth in requirements. 2) Based on a high growth in water requirements as a result of population growth and the high impact of economic development. Assumes no general increase in irrigation. 3) Brackets around numbers indicate a negative balance. 4) Provisional estimates, subject to detailed investigations of environmental impacts and feasibility of developments. D16.3 Key elements of the broad strategic perspectives for the Gouritz water management area At current levels of development, deficits occur in all the sub-areas with the exception of the lower Gouritz River (refer to Table D16.4). The deficits are mainly the result of irrigation requirements that are in excess of the available water, but where farming practices have been adapted accordingly. Particularly in the dry inland areas irrigation is at a very low assurance of supply and large areas are only cultivated in years when water is available. The deficit reflected for the coastal region is mostly attributable to the provision made for implementation of the Reserve. Under current conditions, without formal provision for the full Reserve, all urban/industrial uses can be fully supplied. However, the total irrigation requirements cannot always be supplied from run-of-river. Careful assessment of Reserve requirements and proper implementation planning is therefore necessary. With future growth expected to be concentrated along the coastal belt, a strong growth in water requirements could be experienced in this region. Although significant potential exists for the further _________________________________________________________________________________________________________________ Appendix D Page D16.4 Gouritz WMA National Water Resource Strategy First Edition, September 2004 _____________________________________________________________________________________________ development of surface resources, the occurrence of the resources in an area that is very important environmentally and ecologically sensitive is likely to be a limiting factor. Apart from the general options for reconciling water requirements and availability, as described in Section 2.5, the utilisation of groundwater from the Table Mountain Group aquifers, which currently spills directly into the ocean, may hold good promise and should be investigated further. It is essential for the proper management of water resources in the water management area that the surface water/groundwater interrelationship in the Olifants River valley is clearly understood and quantified. Priority should be afforded to research in this area. A reservation will apply to the Gouritz water management area with respect to the transfer of 0.7 million m³/a of water to the Breede water management area. _________________________________________________________________________________________________________________ Appendix D Page D16.5 Gouritz WMA
