Physics 536
advertisement

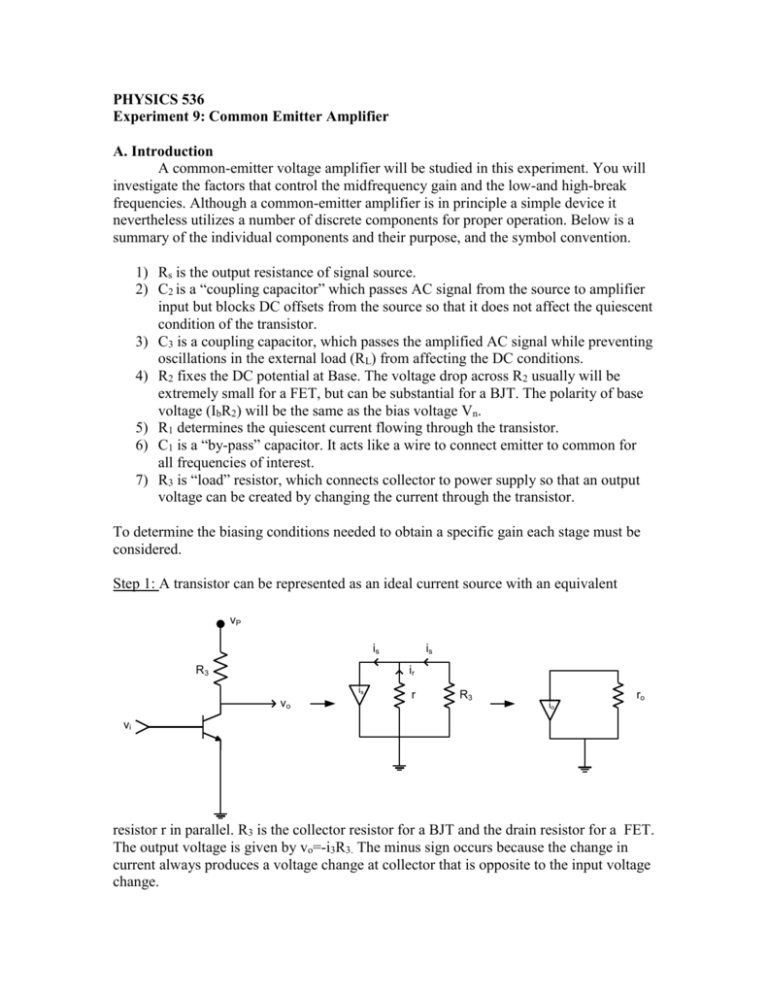
PHYSICS 536 Experiment 9: Common Emitter Amplifier A. Introduction A common-emitter voltage amplifier will be studied in this experiment. You will investigate the factors that control the midfrequency gain and the low-and high-break frequencies. Although a common-emitter amplifier is in principle a simple device it nevertheless utilizes a number of discrete components for proper operation. Below is a summary of the individual components and their purpose, and the symbol convention. 1) Rs is the output resistance of signal source. 2) C2 is a “coupling capacitor” which passes AC signal from the source to amplifier input but blocks DC offsets from the source so that it does not affect the quiescent condition of the transistor. 3) C3 is a coupling capacitor, which passes the amplified AC signal while preventing oscillations in the external load (RL) from affecting the DC conditions. 4) R2 fixes the DC potential at Base. The voltage drop across R2 usually will be extremely small for a FET, but can be substantial for a BJT. The polarity of base voltage (IbR2) will be the same as the bias voltage Vn. 5) R1 determines the quiescent current flowing through the transistor. 6) C1 is a “by-pass” capacitor. It acts like a wire to connect emitter to common for all frequencies of interest. 7) R3 is “load” resistor, which connects collector to power supply so that an output voltage can be created by changing the current through the transistor. To determine the biasing conditions needed to obtain a specific gain each stage must be considered. Step 1: A transistor can be represented as an ideal current source with an equivalent vP is R3 is ir is vo r R3 io ro vi resistor r in parallel. R3 is the collector resistor for a BJT and the drain resistor for a FET. The output voltage is given by vo=-i3R3. The minus sign occurs because the change in current always produces a voltage change at collector that is opposite to the input voltage change. vo (r R ) A 3 3 . vi rm rm can be calculated by Ebers-Moll equation The voltage gain is given by rm 25( mA) I IC Step 2 The signal amplitude from a source depends on the current that the source must provide. vP R3 v3 3 rs 2 i2 ri vs 3 ri is equivalent resistance of source. ri specifies the current that flows in to base. The equivalent circuit shows that a simple voltage divider relation can be used to calculate the decrease in signal amplitude. r v2 vs i rs ri Gain A v3 r r i o vs rs ri rm Step 3 Signals are amplified for a purpose, to be applied to some “load.” vP R3 ro R2 3 i r3 R3 RL 2 1 Since RL is in parallel with R3 and r3 so gain would be modified as r r ,R r rR 1 A i 0 L i o L rs ri rm rs rs ro RL rm r r0 RL A i rs ri rm ro RL r RL A i (a ) rs rC r0 RL We see that the signal VS is attenuated at the input, inverted and amplified by the device with gain “a”, and attenuated at the output by the effect of load. Clearly gain has three parts. r 1) Input attenuation (voltage divider): i rs ri r 2) Device gain a o rm RL 3) Output attenuation (voltage divider): ro RL +25V=Vp 0.1µF R3 C3 vC Vs rs C2 vb R2=1K VL RL R1 C1 470µF R4 Fig. 10.1 -25V=Vn 1. For the circuit given in figure 10.1 the total gain is given by A RiT vL RL iL iH (am ) bL oL oH vs rs RiT r 0 RL IH OH are higher frequency attenuation terms and iL OL are low frequency attenuation terms. So we can see that final gain expression has several components: 1) Device gain 2) Frequency independent input and output attenuation 3) Low frequency attenuation 4) High frequency attenuation The mid-frequency gain of the transistor by itself is called the “device gain.” am vc r (without the external load RL resistor) o vb rm R1 The input ( RiT ) and output ( ro ) resistance result in signal attenuation. The capacitors produce frequency dependent attenuation terms that have the following form: L [1 ( f L / f ) ] 2 1/ 2 H [1 ( f / f H ) ] 2 1 / 2 2. Break Frequencies: The coupling capacitors C2 and input and output. fiL [2 C 2 ( rs RiT )] f oL [2 C3 ( ro RL )] The by-pass capacitor C3 cause low breaks at the 1 1 C1 at the emitter also causes a low break. fbL [2 C1 (rm R1 ), R4 ]1 Stray capacitance and capacitance inside of the transistors cause high breaks at the input and output. fiH [2 Ci (rs , RiT )]1 f oH [2 Co (ro , RL )]1 Notice that the resistors are in series for the low breaks and in parallel for the high breaks. 3. BJT Parameters 25( mA) rm 1 Ic ro (rc , R3 ) rc 4000(rm R1 ) RiT ( R2 , rb ) rb h fe (rm R1 ) 4. FET Parameters rm VT 2 1 I d I dss ro (rd , R3 ) rd 50 K ( mA) / I d RiT R2 (10.1) Vsg VT (1 I d / I dss ) 5. Nonlinearity The I-V relation for transistors is nonlinear, hence the change in current is larger when Vbe is increased rather than decreased. I c I 2 I1 I1 (eVb / 25mV 1) I1 is the quiescent transistor-current. MEASUREMENTS: The same circuit will be used throughout the experiment, but the components will be changed to emphasize the various factors that affect the gain. Arrange the circuit similar to the diagram on page 1 to avoid confusion, and make it easy to change components. The resistance Rs is included to represent the effect of the signal-source resistance. In this representation the signal observed at point A is the “ideal vs ”. Component values are given at the back of these instructions. “D” indicates a direct connection in please of a component, and “X” means the component is not present.. The emitter resistor R1 will be zero until step 18. B. Midfrequency Gain and High-Frequency Attenuation 1) When referring to voltages refer use peak-to-peak voltages. vs will be kept relatively small to minimize non-linearity. Monitor the input signal when the frequency is changed (refer to GIL section 4.3) For I c 1mA , measure the midfrequency gain (vc / vb ) at 10kHz. Observe that the gain is constant in the midfrequency region by varying the signal frequency from 1kHz to 100kHz (i.e. the amplitude of vc should be constant when vb is constant). Measure the output high- break-frequency f oH (refer to GIL sections 5.6, 5.6A). Measure the gain at 10 f oH . Repeat the observations for I c 5mA . (You cannot observe the signal at 10 foH for I c 5mA because that is above the upper limit of the signal generator.) Calculate the midfrequency gain and the output high-break frequency for Ic = 1 mA and 5 mA. The measured break frequencies may not agree with the calculated values from step 1, because that value depended on the assumed value of Co (20 pF). However, the change in break frequency caused by the change in R3 should agree with the calculation. 2) Calculate Co from the measured f oH . The scope probe used for the measurement adds about 10pf to Co . The specifications for the 2N3904 estimates Cbc as 4pf. Estimate the stray capacitance (Cs ) of your circuit from the measured Co . (Cs Co Cbc Cscope ) Cs is relatively high in the plug-in chassis. C. Input Attenuation at Mid- and High-Frequency 3) Use vs =20mV. Measure the midfrequency gain vc / vs , and observe that it is constant from 1kHz to 50kHz. 4) Observe vs and vc and measure the break frequency introduced by Ci . Why is this measurement not affected by the output high-break-frequency? Since Rs 0 in the remainder of the experiment, there will be no high-frequency attenuation at the input. D. Output Attenuation 5) Use vs =20mV. Measure Am vL / vs , and observe that it is constant in the frequency range from approximately 1kHz to 100kHz. E. Low Frequency Attenuation The three low break frequencies will be investigated. Initially you will calculate all three frequencies to see which is dominant and check by measurement. Then the components will be changed to remove the higher breaks so that the lower breaks can be observed. 6) Use vs 20mV . Observe vL to measure the low break frequency that marks the end of the midfrequency region (i.e. the highest of the three breaks). 7) Replace C2 by a direct connection. Observe break-frequency. vL to measure the middle low- 8) Remove C3 . Observe vc top measure the lowest break frequency. F. Transistor Nonlinearity Transistor nonlinearity will be investigated in this part. 9) Connect the scope probe to the collector and use DC couplings at the scope input. Adjust the vertical position control so the trace (which represents the quiescent Vc ) is in the center of the scope. Now apply input signals of 20, and 40mv (p-p) with f=10kHz. Measure the peak values of Vc relative to the quiescent line. The nonlinearity should be very evident, but it may be smaller than calculated in step 14. 10) Increase vs to observe the limits and compare to the calculations in 16. You should notice that you reach the negative limit first as indicated in calculation 14. am and compare. You should also observe vc with an amplitude of approximately 15V (p-p) to see that it 11) Measure is much more symmetric around the quiescent condition than it was in step 15. No report required. G. Common-Source Amplifier The BJT will be replaced by a FET in this section. The pin order is not the same for the two transistors (GI-10.1) Vsg is positive; hence the polarity of the source by-pass capacitor must be reversed. 12) Measure the quiescent voltage at the drain and source. Measure the device gain at 10kHz and observe that it is constant in the frequency range from 1kHz to 100kHz. It should be evident that the gain potential of an FET is much smaller than it is for a BJT. Physics 536 Experiment 10: Components (A) Assume 1 Step Ic 1-2 1 5 5 1 1 1 1 1 1 ? 3-4 5 6 7 8 9-10 11 12 =4000, D=Direct Connection, X=No Connection R1 D D D D D D D D 240Ω D R3 10K 2K 2K 10K 10K 10K 10K 10K 10K 4.7K R4 24K 5.1K 5.1K 24K 24K 24K 24K 24K 24K 10K Rs D D 2K D D D D D D D RL X X X 10K 10K 10K X X X X Initial Components Transistor: 2N3904 Capacitors: 2 0.1 μf, 470 μf Resistors: 1K, 10K, 24K Please pick up the following components later if someone is waiting: Transistor: MPF102 Capacitors: 0.01 μf, 0.05 μf Resistors: 240Ω, 2 of 2 K, 4.7K, 5.1K, 10K C2 C3 D D D D 0.05μf D D D D D X X X 0.01μf 0.01μf 0.01μf X X X X


