geologictimeline_student - Lehigh University Environmental
advertisement
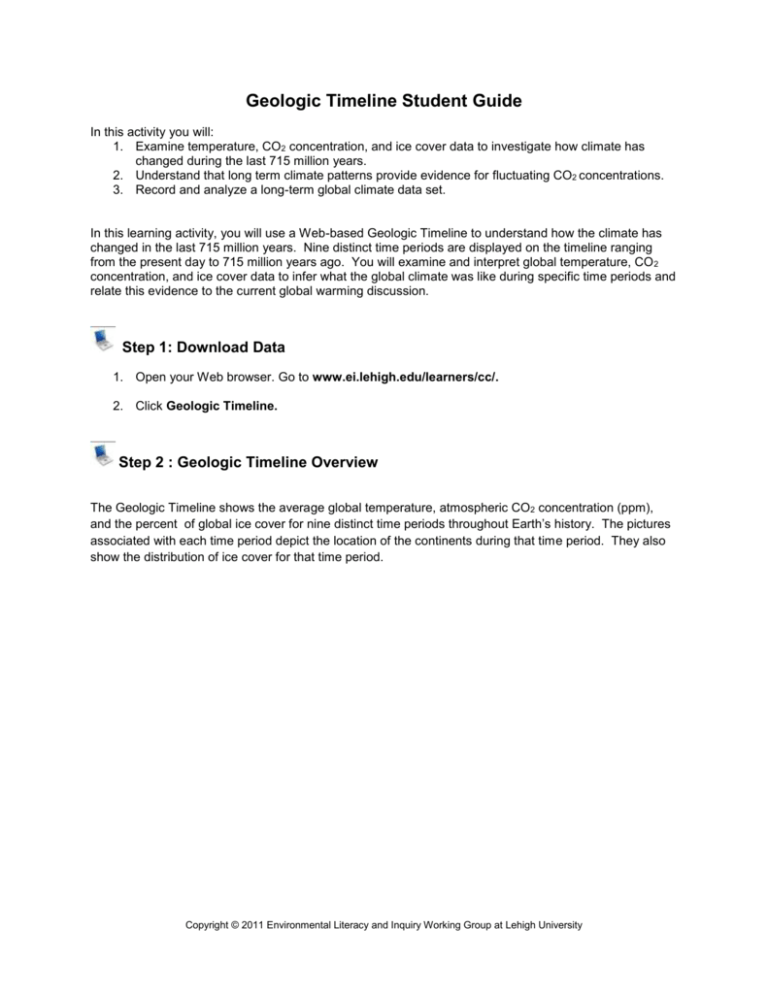
Geologic Timeline Student Guide In this activity you will: 1. Examine temperature, CO2 concentration, and ice cover data to investigate how climate has changed during the last 715 million years. 2. Understand that long term climate patterns provide evidence for fluctuating CO2 concentrations. 3. Record and analyze a long-term global climate data set. In this learning activity, you will use a Web-based Geologic Timeline to understand how the climate has changed in the last 715 million years. Nine distinct time periods are displayed on the timeline ranging from the present day to 715 million years ago. You will examine and interpret global temperature, CO 2 concentration, and ice cover data to infer what the global climate was like during specific time periods and relate this evidence to the current global warming discussion. Step 1: Download Data 1. Open your Web browser. Go to www.ei.lehigh.edu/learners/cc/. 2. Click Geologic Timeline. Step 2 : Geologic Timeline Overview The Geologic Timeline shows the average global temperature, atmospheric CO2 concentration (ppm), and the percent of global ice cover for nine distinct time periods throughout Earth’s history. The pictures associated with each time period depict the location of the continents during that time period. They also show the distribution of ice cover for that time period. Copyright © 2011 Environmental Literacy and Inquiry Working Group at Lehigh University Geologic Timeline Student Guide 1. The Geologic Timeline opens with a column of row labels on the left hand side and a scrolling timeline that moves to the right. 2. The timeline rows include: a. Year - The years shown encompass the time period of the reconstructions below. b. Era - The geologic name for the broad time interval encompassing the reconstruction. c. Period - The geologic name for the specific time period within the era. d. Exploration Image - A thumbnail picture of the locations of the continents during that time period and the distribution of ice cover. e. Average Global Temperature - The average global temperature for the time period of interest. f. Average Global CO2 Concentration The average global CO2 for the time period of interest. g. % Global Ice Cover - The % global ice cover for the time period of interest. 3. The small thumbnail picture associated with each time period is an “exploration image.” When the thumbnail picture is selected, a larger image will appear with a text box at the bottom of the screen. The text box contains additional information about the climate during that time interval. 4. The Geologic Timeline includes the following abbreviations that will be useful to remember: a. b. c. d. CO2 - carbon dioxide ppm - parts per million Ma - millions of years ago ka - thousands of years ago Copyright © 2011 Environmental Literacy and Inquiry Working Group at Lehigh University 2 Geologic Timeline Student Guide Step 3 : Using the Geologic Timeline 1. The Geologic Timeline includes 9 time periods that show a range of climates that occurred during Earth’s history. The time periods used in this activity are to the right. 715 million years ago 540 million years ago 300 million years ago 100 million years ago 2 million years ago 50 thousand years ago 10 thousand years ago 1880 2010 2. The entire Geologic Timeline can be viewed by using the scroll bar underneath the last row of text. The first few time periods are initially displayed. Scroll to the right in order to access the rest of the time periods. 3. Clicking on the “Exploration Image” associated with each time period will activate a text box below the timeline that contains additional information about that time period. 4. Observe the “Exploration Image” and locate the Annual Average Global Temperature (#1), Annual Average CO2 Concentration (#2), and the % Global Ice Cover (#3) for that time period. Copyright © 2011 Environmental Literacy and Inquiry Working Group at Lehigh University 3 Geologic Timeline Student Guide 4 Step 3 : Geologic Timeline Analysis 1. Beginning with the 715 Ma time period, select the small “Exploration Image” icon and read the text in the box that appears. 2. Record the Annual Average Global Temperature, Annual Average CO2 Concentration, and the % Global Ice Cover in the data table provided for Question #1 on the Student Exploration Sheet. 3. After the data has been recorded for the 715 Ma time period, repeat this process and gather data for the eight other time periods. All data should be recorded in the table on the Student Exploration Sheet. 4. Following the information provided in Question #2, plot the data from Question #1 onto the graph on the Student Exploration Sheet. 5. Answer Analysis Questions #3-8 on the Student Exploration Sheet. The questions should be answered in complete sentences. Copyright © 2011 Environmental Literacy and Inquiry Working Group at Lehigh University
