Draft Project 3:
advertisement
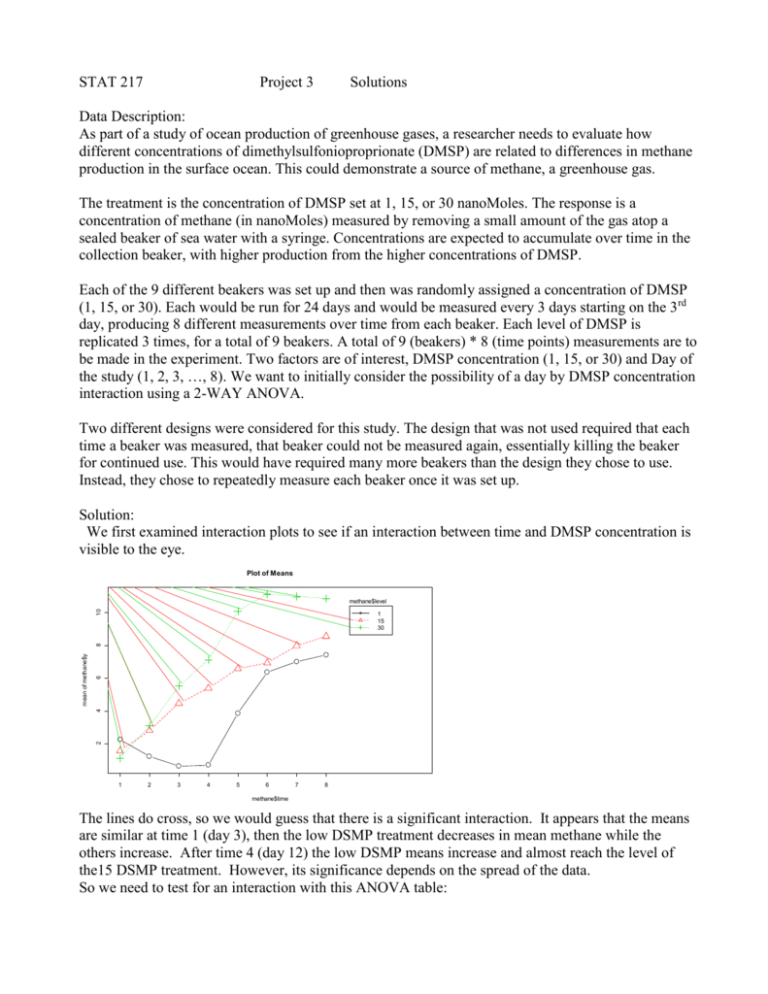
STAT 217 Project 3 Solutions Data Description: As part of a study of ocean production of greenhouse gases, a researcher needs to evaluate how different concentrations of dimethylsulfonioproprionate (DMSP) are related to differences in methane production in the surface ocean. This could demonstrate a source of methane, a greenhouse gas. The treatment is the concentration of DMSP set at 1, 15, or 30 nanoMoles. The response is a concentration of methane (in nanoMoles) measured by removing a small amount of the gas atop a sealed beaker of sea water with a syringe. Concentrations are expected to accumulate over time in the collection beaker, with higher production from the higher concentrations of DMSP. Each of the 9 different beakers was set up and then was randomly assigned a concentration of DMSP (1, 15, or 30). Each would be run for 24 days and would be measured every 3 days starting on the 3rd day, producing 8 different measurements over time from each beaker. Each level of DMSP is replicated 3 times, for a total of 9 beakers. A total of 9 (beakers) * 8 (time points) measurements are to be made in the experiment. Two factors are of interest, DMSP concentration (1, 15, or 30) and Day of the study (1, 2, 3, …, 8). We want to initially consider the possibility of a day by DMSP concentration interaction using a 2-WAY ANOVA. Two different designs were considered for this study. The design that was not used required that each time a beaker was measured, that beaker could not be measured again, essentially killing the beaker for continued use. This would have required many more beakers than the design they chose to use. Instead, they chose to repeatedly measure each beaker once it was set up. Solution: We first examined interaction plots to see if an interaction between time and DMSP concentration is visible to the eye. Plot of Means 10 methane$level 6 2 4 mean of methane$y 8 1 15 30 1 2 3 4 5 6 7 8 methane$time The lines do cross, so we would guess that there is a significant interaction. It appears that the means are similar at time 1 (day 3), then the low DSMP treatment decreases in mean methane while the others increase. After time 4 (day 12) the low DSMP means increase and almost reach the level of the15 DSMP treatment. However, its significance depends on the spread of the data. So we need to test for an interaction with this ANOVA table: Anova Table Response: y Sum Sq Df F value Pr(>F) level 174.42 2 19.0116 8.299e-07 time 542.82 7 16.9051 5.002e-11 level:time 83.65 14 1.3025 0.2411 Residuals 220.18 48 Decision: We fail to reject the null hypothesis that there is no interaction effect. The p-value is larger than any reasonable p-value so we conclude that the interaction, though visible, is not significant. We will assume that a model with just main effects is adequate to describe the mean methane production. Assumptions: Randomization: The beakers were assigned treatments as random. Independence: this assumption is violated because we are measuring a beaker 8 times, and measurements may not be independent. A beaker which has high methane one time is more likely to be high the next time as well. lm(y ~ level * time) Normal Q-Q 28 29 1 0 -1 -2 0 -2 -4 Residuals 2 Standardized residuals 2 Residuals vs Fitted 30 6 8 10 -2 -1 Scale-Location Constant Leverage: Residuals vs Factor Levels 1 0 -1 0.5 1.0 Standardized residuals 29 6 2 2 30 4 1 Theoretical Quantiles 28 2 0 Fitted values -2 1.5 4 28 29 30 0.0 Standardized residuals 2 29 28 30 8 10 level : Fitted values 1 15 30 Factor Level Combinations Normality: The right tail is slightly short, and the left tail slightly long in the Normal QQ plot.The deviation from a straight pattern is not in only a few points, but is across all the residuals. I do question this assumption. Constant Variance: I see no fan shape in the residuals vs fitted or scale-location plots, so I think that the constant variance assumption is met. Additive model ANOVA: Anova Table (Type II tests) Response: y Sum Sq Df F value Pr(>F) level 174.42 2 17.796 7.804e-07 time 542.82 7 15.824 1.012e-11 Residuals 303.83 62 At any reasonable alpha level we reject the null hypothesis that there is no effect for DSMP levels (p-value = 0.00000078) and conclude that the level of DSMP doe have an effect on mean methane production. Similarly, the time variable has a very very small p-value, so we reject the null hypothesis that there is no time effect, and conclude that times do differ in mean methane. When evaluating the full interaction model, we failed to reject the null hypothesis that there was no interaction effect. We could be wrong in that conclusion (as the interaction plot suggested), and might be making a type II error. In that case, it's hard to assess the main effects, and we need to consider time and DSMP level simultaneously. The estimated means from the additive model have this pattern: Plot of Means 10 methane$level 6 4 0 2 mean of fitted(Model.2) 8 1 15 30 1 2 3 4 5 6 7 8 methane$time which looks quite different from the actual data means plot above. We can see the significant DSMP level effect in the separation between the three colored lines, and the significant time effect in the increase from time 1 to time 8. The three lines are perfectly parallel due to the assumption of no interaction. This is a very poor fit to the data at the earlier time points. Looking back at the two anova tables, we see that the main effects are significant in both tables. Their df and SS stay the same. When the interaction line is removed, its 14 df are absorbed into the residual error df and its 83.65 sum of squares is added into the error SS as well. MSE actually increases from 4.59 to 4.90, so F ratios decrease. I expected p-values to increased slightly because F's are smaller, but they decreased due to larger denominator df.. Conclusion: If we gloss over the independence assumption, we obtain the additive model which says that the level of DSMP has an effect on mean methane production, with higher methane produced with greater amounts of DSMP. As time goes by, methane production increases, but it seems to taper off to a plateau at about 20 days. Collecting more data would perhaps allow us to include the interaction as significant. A more complex analysis can adjust for the lack of independence to give this table: Denom. DF: 48 numDF level 2 time 7 level:time 14 F-value 0.94275 9.56602 1.83037 p-value 0.3966 <.0001 0.0612 I would use a large alpha to evaluate the interaction effect, so FTR the null hypothesis of no interaction at = .10.
