EXPERIMENT MMM-1: SPECTRUM ANALYSIS - FOE
advertisement
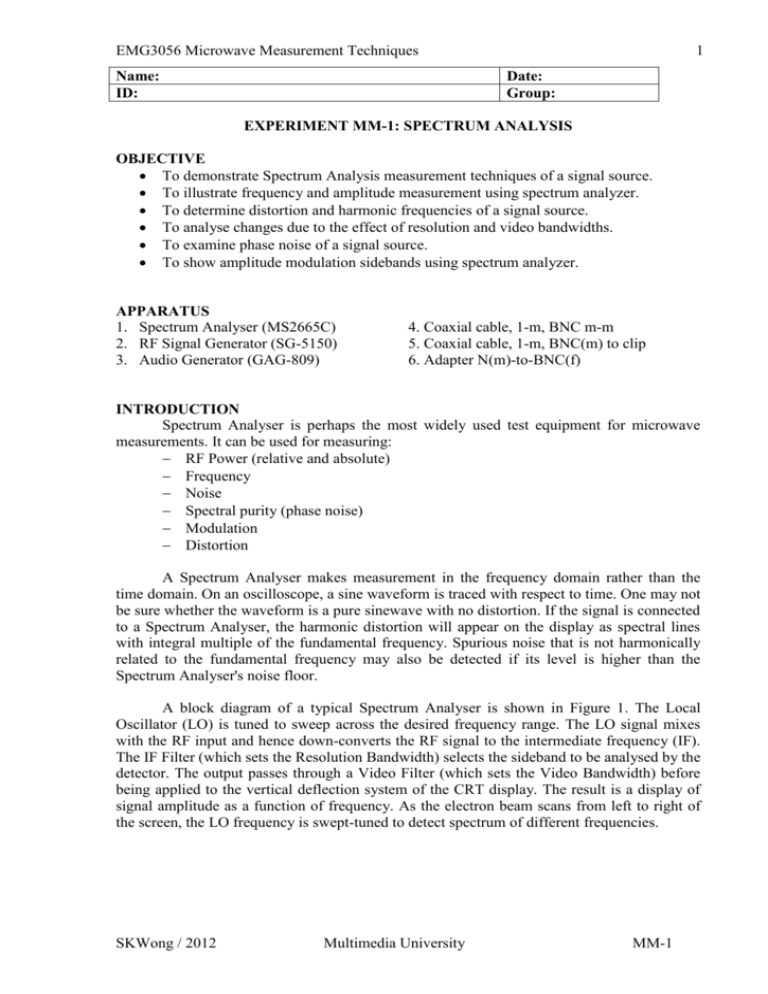
EMG3056 Microwave Measurement Techniques Name: ID: 1 Date: Group: EXPERIMENT MM-1: SPECTRUM ANALYSIS OBJECTIVE To demonstrate Spectrum Analysis measurement techniques of a signal source. To illustrate frequency and amplitude measurement using spectrum analyzer. To determine distortion and harmonic frequencies of a signal source. To analyse changes due to the effect of resolution and video bandwidths. To examine phase noise of a signal source. To show amplitude modulation sidebands using spectrum analyzer. APPARATUS 1. Spectrum Analyser (MS2665C) 2. RF Signal Generator (SG-5150) 3. Audio Generator (GAG-809) 4. Coaxial cable, 1-m, BNC m-m 5. Coaxial cable, 1-m, BNC(m) to clip 6. Adapter N(m)-to-BNC(f) INTRODUCTION Spectrum Analyser is perhaps the most widely used test equipment for microwave measurements. It can be used for measuring: RF Power (relative and absolute) Frequency Noise Spectral purity (phase noise) Modulation Distortion A Spectrum Analyser makes measurement in the frequency domain rather than the time domain. On an oscilloscope, a sine waveform is traced with respect to time. One may not be sure whether the waveform is a pure sinewave with no distortion. If the signal is connected to a Spectrum Analyser, the harmonic distortion will appear on the display as spectral lines with integral multiple of the fundamental frequency. Spurious noise that is not harmonically related to the fundamental frequency may also be detected if its level is higher than the Spectrum Analyser's noise floor. A block diagram of a typical Spectrum Analyser is shown in Figure 1. The Local Oscillator (LO) is tuned to sweep across the desired frequency range. The LO signal mixes with the RF input and hence down-converts the RF signal to the intermediate frequency (IF). The IF Filter (which sets the Resolution Bandwidth) selects the sideband to be analysed by the detector. The output passes through a Video Filter (which sets the Video Bandwidth) before being applied to the vertical deflection system of the CRT display. The result is a display of signal amplitude as a function of frequency. As the electron beam scans from left to right of the screen, the LO frequency is swept-tuned to detect spectrum of different frequencies. SKWong / 2012 Multimedia University MM-1 EMG3056 Microwave Measurement Techniques 2 Video Filter RF input Detector IF Filter LO Sawtooth Generator Y X Display Figure 1: Block diagram of a Spectrum Analyser. Ideally the spectral line for a stable pure sinewave shall be an infinitesimally narrow line on the power-frequency plot. On a practical Spectrum Analyser, a bell-shape response with finite spreading on both sides of the sinewave frequency is displayed. This may be due to the frequency instability of the sinewave source which causes the energy of the carrier to distribute over a finite bandwidth centred around the carrier. However, in most cases it is due to the Spectrum Analyser's IF filter frequency response. The bandwidth of this IF filter, which determines the analyser's Resolution Bandwidth (RBW), is usually user selectable. The display is actually a tracing of the IF filter shape as the LO sweeps across the desired frequency range. Decreasing the RBW improves the ability of the Spectrum Analyser to resolve 2 frequency components that are closely spaced. Since a narrower band-pass filter limits the measurement to a narrower bandwidth, the displayed measurement noise will be lowered. The Video Filter is a low-pass filter which is used to smooth the trace seen on the screen. By reducing the Video Bandwidth (VBW), the peak-to-peak variation of the noise is decreased. When signal level is close to noise level, display smoothing can be used to help find the signal that otherwise might be obscured in the noise floor. A modulated waveform will contain sidebands in addition to the carrier signals. In radio broadcasting and wireless telecommunication systems, Frequency Division Multiple Access (FDMA) is commonly used for multiple radio stations or users to operate at the same time without mutual interference. A Spectrum Analyser must be used to measure the bandwidth occupied by a particular programme or modulated signal to ensure that the sidebands do not extend to the neighbouring channel. Measuring the spectral content of a communication signal and study the spectral profile (the shape of the spectral distribution in frequency domain) is important to ensure that the information is transmitted correctly. For example the percentage modulation of AM signal and modulation index of FM signal can be determined from the spectral distribution. A Spectrum Analyser usually has a built-in frequency counter which can be activated to make accurate frequency measurement for a selected spectral line on the display. The stability of the carrier signal can be measured in term of phase noise (for example, in dBc/1Hz RBW at 10kHz offset). This is a measurement of noise sideband level at a frequency of 10kHz above / below the carrier frequency (unmodulated carrier). Hence the measurement result is in dBc, i.e. dB relative to carrier level. The noise sideband specification is typically normalised to a 1 Hz Resolution Bandwidth (RBW). Built-in firmware is usually available in the Spectrum Analyser to convert the reading measured using other RBW to the required value with 1 Hz RBW. SKWong / 2012 Multimedia University MM-1 EMG3056 Microwave Measurement Techniques 3 LAB PROCEDURE A) Illustrations of Amplitude and Frequency Measurement 1. Turn on the RF Signal Generator. Set the carrier frequency to 100 MHz, with modulation OFF, and output level –40 dBm. Connect the signal to RF Input of the Spectrum Analyser. 2. Set the Spectrum Analyser to a known state by pressing [Preset][Preset All]. 3. Select the frequency range: press [Frequency][Start Freq][98][MHz] [Stop Freq][102][MHz]. 4. Press [Peak Search]. Record the signal level and frequency reading from the Spectrum Analyser. Signal Level: _________________ dBm Frequency: ___________________ MHz Why the signal level shown on the spectrum analyzer differs from the output level of the signal generator (–40 dBm)? Explain briefly. ____________________________________________________________________ ____________________________________________________________________ ____________________________________________________________________ ____________________________________________________________________ ____________________________________________________________________ 5. For the greatest frequency accuracy, use the Spectrum Analyser's built-in frequency counter to read the frequency and amplitude of the signal under test: [Measure][Freq Count][Count On]. Discuss briefly the reasons of using built-in frequency counter. ____________________________________________________________________ ____________________________________________________________________ ____________________________________________________________________ ____________________________________________________________________ ____________________________________________________________________ ____________________________________________________________________ 6. Record the signal frequency (to a resolution of 1 Hz): [Setup][1 Hz] Frequency: ___________________ MHz Outline TWO advantages of using low resolution such as 1 Hz for measurement. ____________________________________________________________________ ____________________________________________________________________ 7. To reduce the sweep time of the Spectrum Analyser, turn off the frequency count function: [Measure][Freq Count][Count Off]. Examine the advantages (if any) of reducing the sweep time of the analyzer. ____________________________________________________________________ ____________________________________________________________________ ____________________________________________________________________ ____________________________________________________________________ B) Determining the Distortion/Harmonic Frequencies of a signal source 8. Press [Frequency][Stop Freq][500][MHz]. Set [RBW] to [Manual][3][kHz]. 9. Set the Signal Generator output level to –20 dBm. 10. Sketch the displayed spectrum, including any harmonics / spurious signals. You can use [Marker][Normal] and [Peak Search][Next Peak] to step through the spectral lines and record the frequencies (in MHz) and amplitudes (in dBm). Record also the noise floor level. SKWong / 2012 Multimedia University MM-1 EMG3056 Microwave Measurement Techniques 4 Analyser Setting AT ST RLV RB VB dB/Div CF SP (AT: Attenuation, ST: Sweep Time, RLV: Reference Level, RB: Resolution Bandwidth, VB: Video Bandwidth, CF: Centre Frequency, SP: Frequency Span.) Attenuation f1 =…………. MHz f2 =…………. MHz f3 =…………. MHz f4 =…………. MHz Noise floor level AT=10 dB dBm dBm dBm dBm dBm AT=20 dB dBm dBm dBm dBm dBm 11. Increase the RF Attenuation setting of the Spectrum Analyser to 20 dB: [Atten][Manual][20][dB]. 12. Use [Marker][Normal] and [Peak Search][Next Peak] to step through the spectral lines and record the frequencies (in MHz) and amplitudes (in dBm). Record also the noise floor level. Explain the impacts of using higher attenuation (such as AT = 20 dB) on the measured fundamental frequency, harmonic frequencies and noise floor level. Justify your answers. ____________________________________________________________________ ____________________________________________________________________ ____________________________________________________________________ ____________________________________________________________________ ____________________________________________________________________ ____________________________________________________________________ ____________________________________________________________________ ____________________________________________________________________ ____________________________________________________________________ ____________________________________________________________________ ____________________________________________________________________ ____________________________________________________________________ SKWong / 2012 Multimedia University MM-1 EMG3056 Microwave Measurement Techniques 5 C) Showing the changes due to the effect of RBW setting 13. Press [Frequency][Centre Freq][100][MHz] and [Span][200][kHz]. 14. Set the video bandwidth: [VBW][Manual][3][kHz]. 15. Set [Marker][Zone Width] to [Spot]. Press [Peak Search] and [Marker][Delta Marker]. 16. Vary the RBW and notice the changes in the displayed trace: [RBW][Manual] [100][kHz] followed by [30][kHz], [10][kHz], [3][kHz], and [1][kHz]. Use the marker function to measure the 3-dB bandwidth of the displayed result. Record the 3-dB bandwidth and sweep time for each setting of RBW. Lower 3-dB Upper 3-dB 3-dB BW = Sweep Time frequency, fL frequency, fH fH - fL (ST) RBW=100kHz RBW= 30kHz RBW= 10kHz RBW= 3kHz RBW= 1kHz Explain the impacts of using lower RBW (such as 1kHz) on the measured fundamental frequency, noise floor level and sweep time (ST). Justify your answers. ____________________________________________________________________ ____________________________________________________________________ ____________________________________________________________________ ____________________________________________________________________ ____________________________________________________________________ ____________________________________________________________________ ____________________________________________________________________ ____________________________________________________________________ D) Examining the Phase Noise of a signal source 17. Set the [RBW] at [1][kHz]. Change [Span] to [50][kHz]. 18. Use the noise measurement capability of the Spectrum Analyser to measure the carrier signal phase noise at a 10-kHz offset. 19. Press [Measure][C/N Ratio Measure][Meas On]. Press [Marker] and then rotate the entry knob to move the delta marker to a frequency which is 10 kHz higher than the carrier frequency. Record the phase noise. Phase Noise: ___________________ dBc/Hz @ 10 kHz offset Explain the significant of phase noise of a signal source. ____________________________________________________________________ ____________________________________________________________________ ____________________________________________________________________ ____________________________________________________________________ ____________________________________________________________________ ____________________________________________________________________ E) Showing the changes due to effect of VBW setting 20. Press [Measure][Off] and [Marker][Marker Off]. Set [Span] to [100][kHz]. 21. Set VBW at 10 Hz and RBW at 1 kHz. 22. Reduce the RF Signal Generator output level to about 3 dB above the noise floor level of the Spectrum Analyser. SKWong / 2012 Multimedia University MM-1 EMG3056 Microwave Measurement Techniques 6 23. Vary the VBW and notice the changes in the sweep time: [VBW][Manual] [10][Hz] followed by [100][Hz], [1][kHz], [10][kHz]. Observe the changes in the displayed trace. Record the sweep time for each VBW setting. Sweep Time (ST) VBW= 10Hz VBW= 100Hz VBW= 1 kHz VBW=10 kHz Interpret the observation of the displayed trace: ____________________________________________________________________ ____________________________________________________________________ ____________________________________________________________________ ____________________________________________________________________ ____________________________________________________________________ ____________________________________________________________________ F) Showing the Amplitude Modulation Sidebands 24. Turn on AM modulation of the RF Signal Generator, with External modulating source, at 30% modulation index. Set the output level to -30 dBm. 25. Connect the Audio Generator output to the “External Modulation” input of the RF Signal Generator. 26. Set the Audio Generator frequency to 10 kHz and the Attenuator level to –20 dB. Increase the Amplitude of the Audio Generator output to a suitable level (in which both the HIGH and LOW lights next to the Modulation Index reading of the RF Signal Generator are off). 27. Sketch the displayed trace of the Spectrum Analyser (RBW = 1 kHz, Span = 100 kHz). Analyser Setting AT ST RLV RB VB dB/Div CF SP 28. Change the RBW to 10 kHz. Sketch the displayed trace on the same graph of step 27. SKWong / 2012 Multimedia University MM-1 EMG3056 Microwave Measurement Techniques 7 Explain the impacts of using RBW = 10 kHz on the measured modulated signal (on carrier and sidebands). Justify your answers. ____________________________________________________________________ ____________________________________________________________________ ____________________________________________________________________ ____________________________________________________________________ ____________________________________________________________________ ____________________________________________________________________ Overall Discussion and Conclusion ____________________________________________________________________ ____________________________________________________________________ ____________________________________________________________________ ____________________________________________________________________ ____________________________________________________________________ ____________________________________________________________________ ____________________________________________________________________ ____________________________________________________________________ ____________________________________________________________________ ____________________________________________________________________ ____________________________________________________________________ ____________________________________________________________________ ____________________________________________________________________ ____________________________________________________________________ ____________________________________________________________________ ____________________________________________________________________ ____________________________________________________________________ ____________________________________________________________________ ____________________________________________________________________ ____________________________________________________________________ ____________________________________________________________________ ____________________________________________________________________ ____________________________________________________________________ ____________________________________________________________________ ____________________________________________________________________ ____________________________________________________________________ ____________________________________________________________________ ____________________________________________________________________ ____________________________________________________________________ ____________________________________________________________________ ____________________________________________________________________ ____________________________________________________________________ ____________________________________________________________________ ____________________________________________________________________ ____________________________________________________________________ ____________________________________________________________________ ____________________________________________________________________ ____________________________________________________________________ ____________________________________________________________________ ____________________________________________________________________ ____________________________________________________________________ SKWong / 2012 Multimedia University MM-1 EMG3056 Microwave Measurement Techniques 8 ____________________________________________________________________ ____________________________________________________________________ ____________________________________________________________________ ____________________________________________________________________ ____________________________________________________________________ ____________________________________________________________________ ____________________________________________________________________ ____________________________________________________________________ ____________________________________________________________________ ____________________________________________________________________ NOTE No report is needed for this experiment. You would be evaluated on-the-spot during the experiment. Your are required to submit all the observations, results and discussions in this sheet at the end of the experiment. Evaluation Schemes (20%) Understanding of fundamental concepts – 5% Ability to explain the procedures involved – 5% Ability to identify or determine expected results – 5% Ability to explain or elaborate the results – 5% SKWong / 2012 Multimedia University MM-1
