Solutions #9 - Bryn Mawr College
advertisement

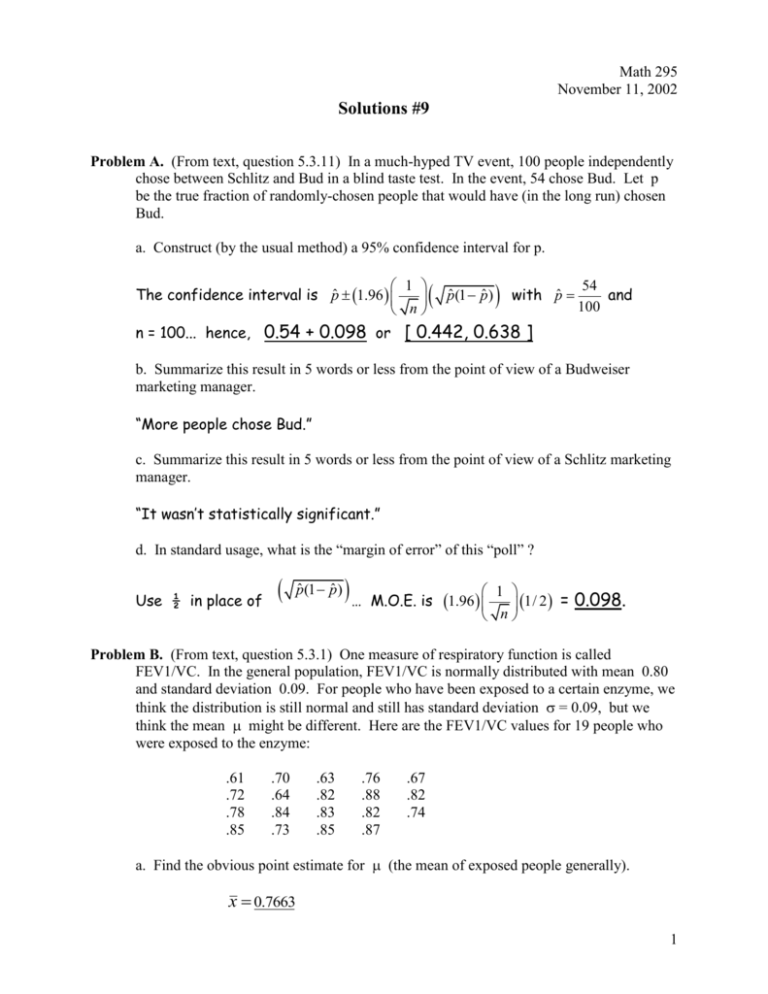
Math 295 November 11, 2002 Solutions #9 Problem A. (From text, question 5.3.11) In a much-hyped TV event, 100 people independently chose between Schlitz and Bud in a blind taste test. In the event, 54 chose Bud. Let p be the true fraction of randomly-chosen people that would have (in the long run) chosen Bud. a. Construct (by the usual method) a 95% confidence interval for p. 1 The confidence interval is pˆ 1.96 n pˆ (1 pˆ ) with pˆ 54 and 100 n = 100... hence, 0.54 + 0.098 or [ 0.442, 0.638 ] b. Summarize this result in 5 words or less from the point of view of a Budweiser marketing manager. “More people chose Bud.” c. Summarize this result in 5 words or less from the point of view of a Schlitz marketing manager. “It wasn’t statistically significant.” d. In standard usage, what is the “margin of error” of this “poll” ? Use ½ in place of pˆ (1 pˆ ) … M.O.E. is 1 1/ 2 = 0.098. n 1.96 Problem B. (From text, question 5.3.1) One measure of respiratory function is called FEV1/VC. In the general population, FEV1/VC is normally distributed with mean 0.80 and standard deviation 0.09. For people who have been exposed to a certain enzyme, we think the distribution is still normal and still has standard deviation = 0.09, but we think the mean might be different. Here are the FEV1/VC values for 19 people who were exposed to the enzyme: .61 .72 .78 .85 .70 .64 .84 .73 .63 .82 .83 .85 .76 .88 .82 .87 .67 .82 .74 a. Find the obvious point estimate for (the mean of exposed people generally). x 0.7663 1 b. Construct a 95% confidence interval for . 1 Use x (1.96) . We are assuming that we know , so we can 19 use it in preference to sx (which is 0.0859). Since we are assuming that the underlying population is normal, we can expect X-bar to be normally distributed even if n < 30. This formula gives 0.7663 0.0405 or 0.7258,0.8068 . c. Is it plausible that = .80; that is, that the exposed people have the same distribution as the general population? From the point of view of the 95% confidence interval, yes, since =0.80 is within the interval. Even if 0.80 were a bit outside the interval, it would be hard to say that this value is “implausible” based on a 95% significance level. Problem C. A certain random variable W is normally distributed with mean 15.0 and standard deviation 4.0. What is P(W > 24.33), the probability that any particular draw from this distribution is greater than 24.33 ? W 15.0 . Then Z is the “standardized” version of W, and 4.0 Z has a standard normal distribution. Clearly, W > 24.33 if and only if 24.33 15.0 2.33 . From a table or calculator, the standard normal Z> 4.0 lower tail probability corresponding to 2.33 is 0.990. We want the Define Z upper tail probability, P(W>24.33) = P(Z>2.33) = 1 – 0.990 = 0.010. 2 Problem D. Examination of the daily percentage returns from holding UAL stock during the period 1987-2001 gives these summary values: number of observations: 3785 average daily return: 0.000185 (that is, about (2/100)% per day) sample standard deviation (sx): 0.021115 (meaning, typical days’ returns were on the scale of +– 2%) (Should I have listed all 3785 values? Ask for them if you want them.) Suppose we have a theory that the returns are all drawn independently from the same distribution, and that it has mean , standard deviation . a. What are reasonable point estimates for and ? ˆ x 0.000185, ˆ sx 0.021115. b. Find any reasonable confidence interval for . 95% confidence interval: 1.96 0.021115 or 0.000185 0.000673 0.000185 3785 For a 90% confidence interval, use 1.65 in place of 1.96, etc. to get 0.000185 0.000566 . c. Suppose that this distribution is actually normal, and that is exactly what your point estimate says it is. From these observations only, what do you think is the probability that is actually positive? Since 0.00 is well inside even a 90% confidence interval (or even a one-sigma confidence interval) we can’t have much confidence in being positive. If we want to say that UAL is a good stock to invest in, we should have some evidence beyond even this 15-year data set. Problem E. Here are the amounts of monetary damage, in each of the 101 years 1900-2000, from eruptions of Mt. St. Helens: 1900 1901 1902 etc. 1979 1980 1981 etc. 2000 $0 $0 $0 $0 $0 $ 4 billion $0 $0 $0 Assume these are independent draws from some distribution with mean . 3 a. Do the best you can to construct a 95% confidence interval for . Use n = 101, x $4 bil. $39.6 mil. , and 101 sx $398 mil. This gives a 95% confidence interval of $ 39.6 mil +– $77.6 mil. or [ –$38 mil , +$117.2 mil. ]. b. Does it make any sense? Not much sense. Negative numbers aren’t possible for this variable, and even if they were possible, they have never been observed in 101 random draws. So including negative numbers in the confidence interval is pretty silly. What’s going on here is that the underlying distribution is nowhere near normal, and despite the central limit theorem and the fact that n ≥ 30, X isn’t close to a normal distribution either. So the logic behind the confidence interval doesn’t hold up well. This situation is a serious problem for insurance companies. There are better methods, but no really good methods. 4


