Class 4
advertisement
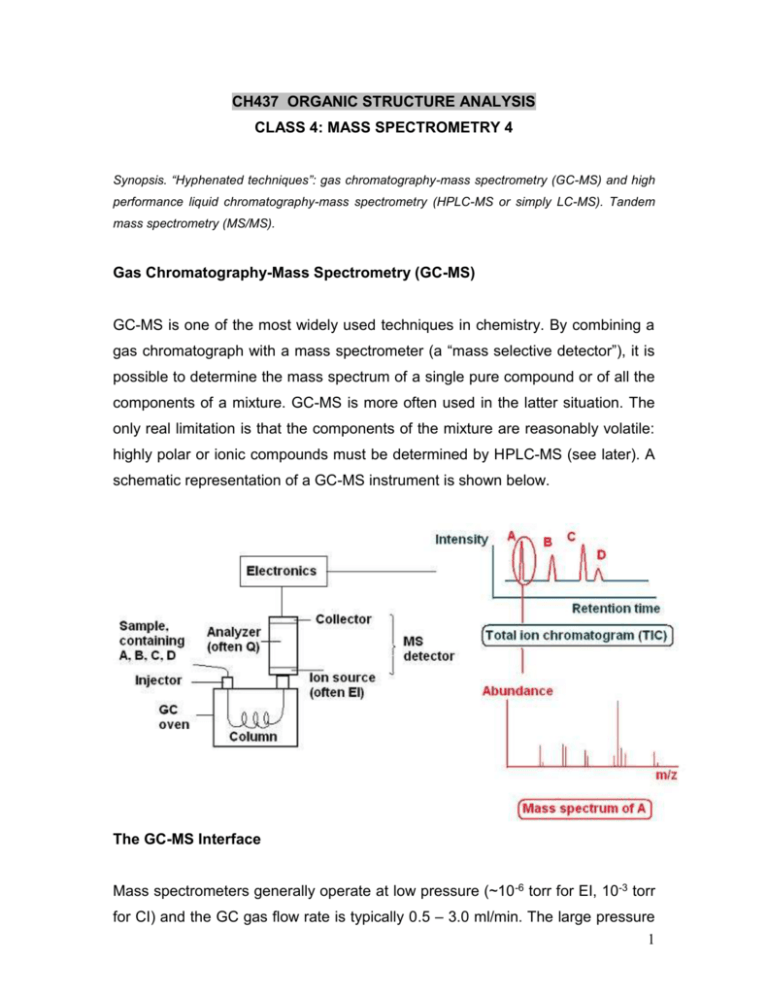
CH437 ORGANIC STRUCTURE ANALYSIS CLASS 4: MASS SPECTROMETRY 4 Synopsis. “Hyphenated techniques”: gas chromatography-mass spectrometry (GC-MS) and high performance liquid chromatography-mass spectrometry (HPLC-MS or simply LC-MS). Tandem mass spectrometry (MS/MS). Gas Chromatography-Mass Spectrometry (GC-MS) GC-MS is one of the most widely used techniques in chemistry. By combining a gas chromatograph with a mass spectrometer (a “mass selective detector”), it is possible to determine the mass spectrum of a single pure compound or of all the components of a mixture. GC-MS is more often used in the latter situation. The only real limitation is that the components of the mixture are reasonably volatile: highly polar or ionic compounds must be determined by HPLC-MS (see later). A schematic representation of a GC-MS instrument is shown below. The GC-MS Interface Mass spectrometers generally operate at low pressure (~10 -6 torr for EI, 10-3 torr for CI) and the GC gas flow rate is typically 0.5 – 3.0 ml/min. The large pressure 1 change at the GC-MS interface means that powerful pumps are needed to pump away excess gas, before the components can be ionized. Nowadays, this can be done so effectively that the end of the GC capillary column can be placed right inside the ion source. Recording Mass Spectra Capillary columns in modern GC instruments have high efficiencies, which means that the peak widths are narrow, typically of only a few seconds. This in turn means that the mass spectrum of each component should be scanned as rapidly as possible, so that the change in concentration of the component, as it elutes, is small and does not distort the mass spectrum. Quadrupole analyzers are able to scan the m/z range (typically 35 – 350 units) very rapidly and hence are ideal for GC-MS, despite their other limitations (see class 2). In practice, the mass spectrometer is programmed to scan continuously (say every 0.5 seconds) during the course of a GC run, over a pre-selected range of m/z values (e.g. 35 – 350 units). This means that a typical chromatographic peak of width say 5 or 10 seconds, will be scanned many times during the chromatographic run. In this way, the optimum scanning (close to the peak maximum) can be obtained for each (fully resolved) peak, as shown below. For unresolved peaks (co-eluting components), continuous rapid scanning can still result in optimum mass spectra for each component, as shown below. 2 Total Ion Chromatogram (TIC) Mode and Selected Ion Monitoring (SIM) Mode The description in the previous section is that of a TIC mode. For the whole of the chromatographic run, the pre-selected mass range (say, 40 – 400 m/z) is scanned every (say) 0.5 seconds. TIC is the most common scanning mode, especially when it is needed to identify unknown components of a mixture. If, however, there is some prior knowledge of the components or if we are searching for specific substances in a mixture, then the selected ion monitoring (SIM) mode can be used. Here, ions of specific m/z values (often 2 – 5 characteristic and abundant ions), and no other ions, are monitored during the GC separation. Hence, only components whose mass spectra contain ions of the pre-selected m/z values will be recorded as chromatographic peaks; all other data is not saved. An example is shown below. 3 Choice of SIM mode has the effect of greatly simplifying the chromatogram and greatly enhances the sensitivity of the GC-MS experiment (detection limits are often improved from ng/l levels to pg/l levels). Data Manipulation Once a chromatogram (most usually a TIC) has been obtained, the data can be manipulated in a variety of ways, the most common of which is the first one described below. 1. Identification of Components (structure determination) Library search. By digital (or manual) comparison of the mass spectrum of a component with those in a proprietory mass spectral library (e.g. NIST or Wiley) or an “in-house” library, it is often possible to positively identify an eluted component, especially if the retention time (or better, Kovats or similar retention index) is taken into account. Fragmentation examination. By examination of the fragmentation pattern revealed in the mass spectrum of a component where the library match is poor, a skilled mass spectroscopist may be able to identify the component. Tandem mass spectrometry (MS/MS) may help here (see later). 4 2. Background subtraction. Spurious peaks in the mass spectra of components are often due to “column bleed”: slow decomposition of the capillary column stationary phase under the conditions of repeated GCMS experiments, often needing high oven temperatures. Luckily, mass spectra of the breakdown products (often polysiloxanes) are well known and can be fully subtracted from the mass spectra of each component, as illustrated below. 3. Resolution Enhancement. By examining the scans across a suspected unresolved peak, the computer is able to resolve the peak into two closely separated actual peaks. It is thus possible to obtain the mass spectrum of both components. 4. Mass Chromatograms. If components of a mixture are chemically similar and their mass spectra contain characteristically abundant ions of particular m/z values, then the computer can be requested to include only those peaks in the chromatogram that correspond to components that 5 have ions of those m/z values in their mass spectra. An example is shown below. High Performance Liquid Chromatography-Mass Spectrometry (HPLCMS) The coupling of HPLC with a mass spectrometric detector has been much more problematic than GC-MS. The main reasons for this are: 1. Gas phase ions must be produced (from liquid phase compounds) for mass spectrometry: HPLC is normally used for less volatile, more polar compounds. 2. The huge volume of solvent (even using low flow rates and micro or capillary columns) has to be eliminated. The many different kinds of HPLC-MS systems can be characterized by the methods by which the above problems are solved (i.e. by the interface). These are described below. 1. Methods that involve selective vaporization of solvent prior to introduction of analytes into the MS ion source. The moving belt interface and particle beam interface (PBI) are of this type, and are of historic value, but have now been largely replaced by the interfaces discussed next. 6 2. Methods that involve severe reduction of eluent flow rate (~5 l/min) and then direct introduction into the MS ion source. This needs either a capillary HPLC column or a flow splitter. Examples are direct liquid introduction (DLI) and continuous-flow fast atom bombardment (CF-FAB). Sensitivity can be compromised by the low level of sample. 3. Methods that involve direct introduction of the whole eluent into the interface prior to ionization. These are the methods of choice nowadays: they include electrospray ionization (ESI), ionspray (ISP) ionization, thermospray (TSP) ionization and atmospheric pressure chemical ionization (APCI). See class 1/2 for details of some of these. 4. ESI tolerates up to 0.2 ml/min flow rate, the remainder up to 1.0 ml/min. Polar solvents, such as acetonitrile, methanol and water (or mixtures of these) are needed. Buffers can be used (especially volatile buffers, such as ammonium formate), but only in low concentrations. Buffer ions (e.g. Na+) usually form adducts (m/z ~ M + 23) with molecular ions when ESI is used. All these methods have high sensitivity, because the whole eluent enters the ionization in relatively large quantities. The application range of the various contemporary HPLC-MS coupling methods is shown in the diagram overleaf (the GC-MS range is shown for comparison). Recording mass spectra and data manipulation in HPLC-MS is similar to GCMS. Note also that capillary zone electrophoresis (CZE) and capillary electrochromatography (CEC) can be coupled with mass spectrometry, especially if ESI is used. 7 An example of HPLC-MS chromatogram is shown below. 8 Tandem Mass Spectrometry Tandem mass spectrometry, sometimes known as MS/MS (or MSn) refers to instruments in which at least two independent stages of m/z analysis are used. This can be done either with the same analyzer (MS/MS “in time”) or using additional analyzers (MS/MS “in space”). The most common use of tandem MS is in structure determination (but see later), as summarized below. spontaneous mp+ mf+ + or by activation precursor ion (found in spectrometer 1) mn neutral fragment fragment ion (analyzed in spectrometer 2) The most common type of MS/MS instrument is the “triple quad”, with three quadrupole analyzers, although only two are used for mass spectrometry (see next): its symbol is QqQ. An example is shown in the diagram below and the 9 most usual kind of MS/MS experiment, known as “product ion scan” is described next in relation to this diagram. The first quadrupole (Q) is used to select ions (precursor ions) of a particular m/z value. The middle one (q) is used for excitation (usually collisional activation) of these ions. The last quadrupole (Q) analyzes the fragment ions produced by decomposition of the precursor ions in the middle quadrupole space. The practical limit to the number of analyzers used in MS/MS in space experiments is 3 or 4 (MS3/MS4). Typical in space tandem MS arrangements are QqQ, QqTOF, BEqQ, BqQ. Tandem MS of the “in time” type can be performed using quadrupole ion trap (QIT), ion cyclotron resonance (ICR) and time-of-flight (TOF) analyzers. The practical limit to the number of determinations that can be carried out using in time MS/MS is 8 (MS 8). A comparison of in space and in time types of tandem MS is shown below. 10 The different scan modes in tandem MS, and hence some uses of the technique, are summarized in the diagram below. The first type is the most widely used and is illustrated by the example in the diagram below. The standard ESI mass spectrum of swertisin, a polyphenolic substance found in many plants, such as Gentiana ottonis is shown in the diagram below. Swertisin is composed of two parts; a flavone and a 11 monosaccharide unit, but it is of interest to know how these two units are linked: polyphenolic glycosides often have linkages to sugars via oxygen. The existence of a low abundance fragment peak at m/z 327 suggests that the sugar moiety is not cleaved in its entirety, which in turn suggests a Clinked sugar. The product ion scan on m/z 327 reveals fragment ions at m/z 121, 163 and 191, the latter two of which are known to be exclusively observed for 6-C glycosyl flavones. % Abundance 100 Standard ESI spectrum H3CO HO HO HO O 6 A OH OH O H+ OH 1 O C 80 B 447 [M+H+] MS 60 m/z = 447 40 OH H3CO O + H2O OH O H3CO O C 100 m/z = 327 OH A +CH2 O B O m/z = 191 327 [M+H+-120] 20 + C O m/z = 121 - CO m/z = 163 200 300 400 500 m/z % Abundance 100 327 [M+H+-120] Product ion scan spectrum of m/z 327 80 MS2 60 163 40 20 121 100 191 200 300 400 500 m/z Uses of Tandem Mass Spectrometry Some of the major uses of MS/MS have already been described and are connected with structure determination. In this context, a powerful combination is ESI-MS-MS, since ESI tends to give mass spectra with intense molecular ions. Collisional activation of the molecular ion and subsequent analysis of the product ions (this can be done several times = MS4, say) 12 usually reveals much structural information. Apart from structure elucidation, tandem MS has the following applications: Selective detection of target compound class. Study of ion-molecule reactions. An example of the selected detection of target compound class is given next: detection of carnitines in crude biological fluids. Carnitines are shown to undergo MS fragmentation by routes A, B and C, below. Route A Route C + O O +. + (CH3)3N O O OH OH O + (CH3)3N O O OH R R m/z = M _ m/z = 144 m/z = M 59 Route B + + O C m/z = M O R _ 161 OH m/z = 85 The only variable in carnitine structures is R (= CH3, C2H5, etc). Route A gives ions of fixed m/z (144 and 85), irrespective of the nature of R, whereas routes B and C involve loss of fixed mass neutral fragments (161 and 59 respectively). Hence MS/MS using either a precursor ion scan or a neutral loss scan may help in the detection of carnitines amongst other compounds in mixtures, such as biological fluids (like urine). Spectrum (a) below is of a urine sample, showing possible carnitine peaks (*) amongst many others. Spectrum (b) is produced by MS/MS precursor ion-scan of the m/z 85 fragment ion, and shows the carnitine molecular ions giving rise to this fragment ion. There can be seen carnitine (without the ester group; m/z = 162), acetylcarnitine (R = CH3; m/z = 204), propionylcarnitine (R = C2H5; m/z = 218) (all marked *) and others (not marked). 13 14
