Exam 1
advertisement
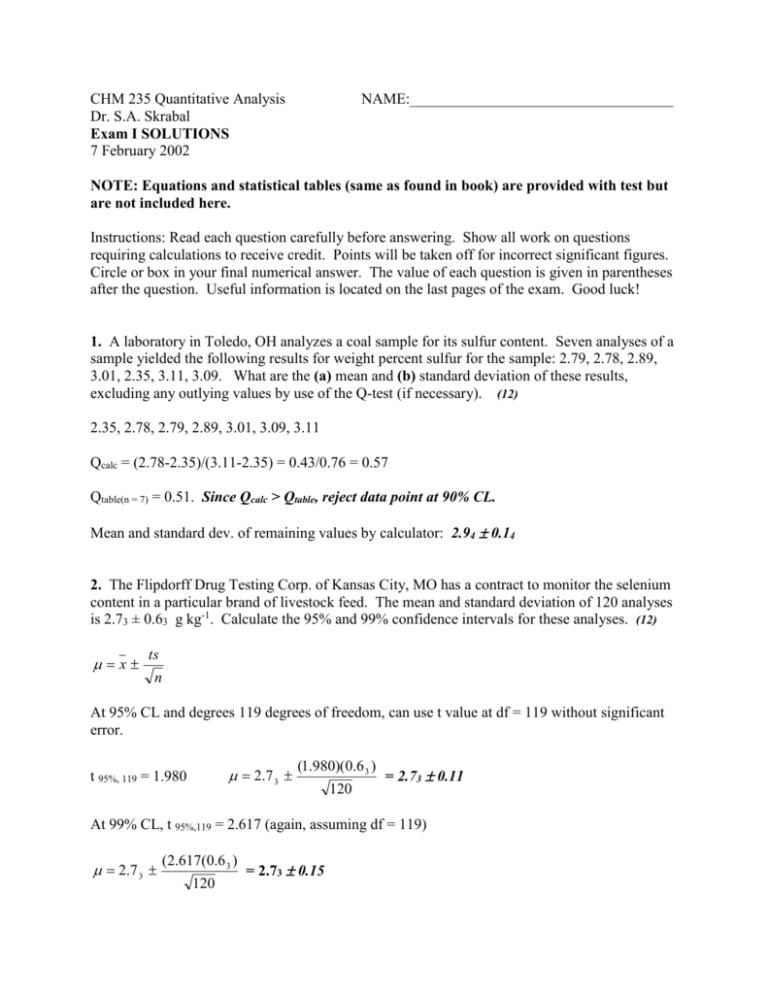
CHM 235 Quantitative Analysis Dr. S.A. Skrabal Exam I SOLUTIONS 7 February 2002 NAME:___________________________________ NOTE: Equations and statistical tables (same as found in book) are provided with test but are not included here. Instructions: Read each question carefully before answering. Show all work on questions requiring calculations to receive credit. Points will be taken off for incorrect significant figures. Circle or box in your final numerical answer. The value of each question is given in parentheses after the question. Useful information is located on the last pages of the exam. Good luck! 1. A laboratory in Toledo, OH analyzes a coal sample for its sulfur content. Seven analyses of a sample yielded the following results for weight percent sulfur for the sample: 2.79, 2.78, 2.89, 3.01, 2.35, 3.11, 3.09. What are the (a) mean and (b) standard deviation of these results, excluding any outlying values by use of the Q-test (if necessary). (12) 2.35, 2.78, 2.79, 2.89, 3.01, 3.09, 3.11 Qcalc = (2.78-2.35)/(3.11-2.35) = 0.43/0.76 = 0.57 Qtable(n = 7) = 0.51. Since Qcalc > Qtable, reject data point at 90% CL. Mean and standard dev. of remaining values by calculator: 2.94 0.14 2. The Flipdorff Drug Testing Corp. of Kansas City, MO has a contract to monitor the selenium content in a particular brand of livestock feed. The mean and standard deviation of 120 analyses is 2.73 ± 0.63 g kg-1. Calculate the 95% and 99% confidence intervals for these analyses. (12) x ts n At 95% CL and degrees 119 degrees of freedom, can use t value at df = 119 without significant error. 2.7 3 t 95%, 119 = 1.980 (1.980)(0.6 3 ) 120 = 2.73 0.11 At 99% CL, t 95%,119 = 2.617 (again, assuming df = 119) 2.7 3 (2.617(0.6 3 ) 120 = 2.73 0.15 3. Sydney, the Quant Lab student, analyzes a sample five times for Fe concentration. By entering the results on her TI-86 calculator, she obtains the following results for mean and standard deviation: 9.44321 ± 0.03998 ppb. Express the mean, the absolute uncertainty, and the percent relative uncertainty, all with the correct number of significant figures. (12) Absolute: 9.44 0.039 ppb or 9.44 0.04 ppb Relative: (0.039/9.44)100 = 0.41% - 9.44 0.41% ppb or 9.44 0.4% ppb 4. Another Quant Lab student prepares a solution by pipetting 10.0 ± 0.02 mL of 0.75 ± 0.03 M CuCl2 solution to 100.0 ± 0.2 mL. What are the concentration and absolute and relative uncertainty of the diluted solution? (Remember Cconc Vconc = Cdil Vdil.) (12) CconcVconc 0.75 ( 0.03) M 10.0 ( 0.02) mL 0.075 ? µM Vdil 100.0 ( 0.2) mL Convert to relative uncertainties: (0.03/0.75)100 = 4.0% (0.02/10.0)100 = 0.20% (0.2/100.0)100 = 0.20% C dil %eoverall (4.0 %) 2 (0.2 0 %) 2 (0.2 0 %) 2 = 4.0% Convert relative to absolute uncertainty: (4.0%)(0.075 µM) = (0.040)(0.075 µM) = 0.0030 µM Cdil = 0.075 4.0% µM and 0.075 0.0030 µM 5. A calibration curve for dissolved manganese was obtained by measuring absorbances in a spectrophotometric analysis, using Mn standards in a range from 0 to 3.0 µM. The data were analyzed using Excel®, and the following parameters of the regression were calculated: slope: 0.2723 ± 0.0073 y-intercept: 0.0017 ± 0.0010 std. dev. of y values: 0.0027 An unknown sample was analyzed, yielding an absorbance of 0.478. Assume the blank is zero. Calculate (a) the Mn concentration of the unknown sample (in µM) and (b) the relative and absolute uncertainty of this concentration. (15) y = mx + b ; x conc. = yb abs. b conc. m m 0.478 ( 0.002 7 ) 0.0017 ( 0.0010 ) 1.74 9 ? M 0.272 3 ( 0.007 3 ) enumerator = (0.002 7 ) 2 (0.0010 ) 2 0.0028 %enumerator = ( 0.0028 )100 0.58 % (0.478 0.0017 ) %edenom = ( 0.007 3 )100 2.6 % 0.272 3 %eoverall = (0.58 %) 2 (2.6 %) 2 2.6 % Convert to absolute uncert.: (2.6%)(1.749 µM) = (0.026)(1.749 µM) = 0.045 µM Answer: 1.749 0.045 µM and 1.749 2.6% µM 6. Give a brief description of a type of systematic error that might be encountered in a typical introductory chemistry laboratory exercise. (7) Poorly calibrated or uncalibrated balance, glassware, pipets, spectrophotometers, pH meter, etc. 7. Two laboratories, one in Boston, MA and one in Marseilles, France, are comparing their results for the analysis of dissolved arsenic in the same groundwater sample using an atomic absorption spectrophotometric technique. The French lab analyzed the sample 8 times, obtaining a mean of 10.32 ppb with a standard deviation of 0.94 ppb. The Boston lab analyzed the sample 9 times, obtaining a mean of 8.71 ppb and standard deviation of 0.52 ppb. Using the appropriate statistical test, determine whether or not the two labs obtained the same results at the 95% confidence level. (15) s pooled t calc (0.9 4 ) 2 (8 1) (0.5 2 ) 2 (9 1) 0.746 892 10.32 8.71 0.746 (8)(9) 4.44 89 ttable (CL = 95%, df = 15) = 2.131 (remember df for t-test is n1 + n2 –2) Since tcalc > ttable, results are significantly different at the 95% confidence level 8. (a) What is the molarity of a 170 ppm aqueous solution of potassium nitrate (KNO3)? (8) 170 ppm = 170 mg/L (170 mg KNO3/L)(1 g/1000 g)(1 mol KNO3/101.11 g KNO3) = 1.68 x 10⁻³ mol/L (b) What is the concentration (in ppm) of NO3- in this solution? (7) (1.68 x 10⁻³ mol KNO3/L)(1 mol NO3-/1 mol KNO3)(62.01 g NO3-/1 mol NO3-)(1000 mg/g) = 104 mg/L = 104 ppm

