Name: Date: Class: Weather Project You will gather data over time
advertisement
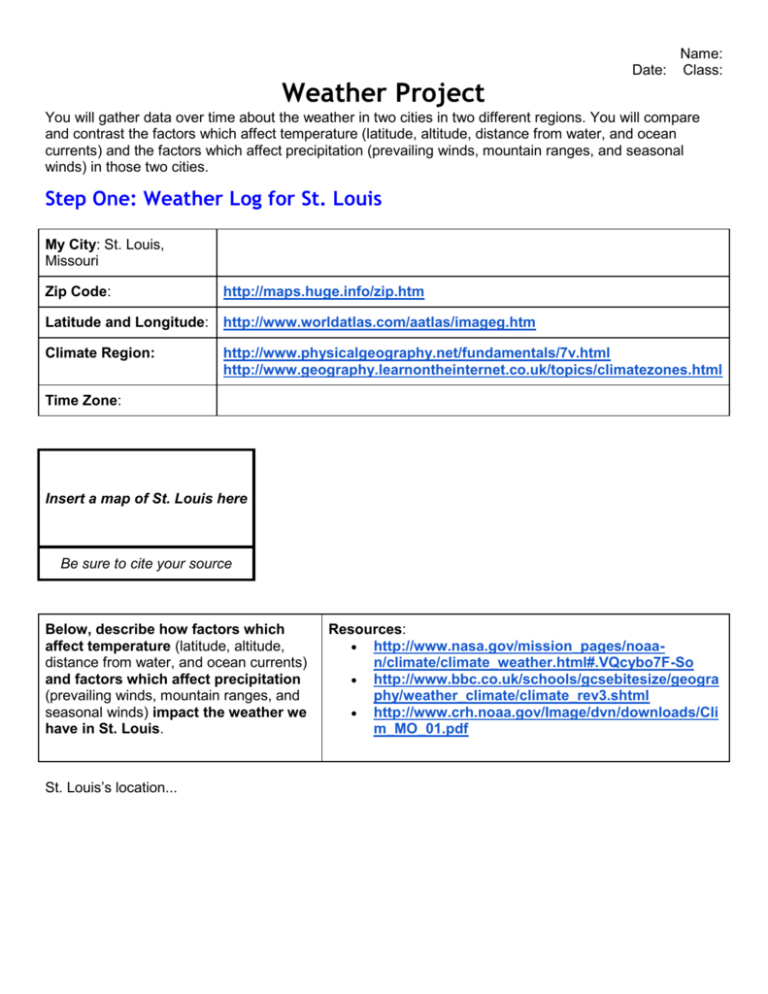
Weather Project Date: Name: Class: You will gather data over time about the weather in two cities in two different regions. You will compare and contrast the factors which affect temperature (latitude, altitude, distance from water, and ocean currents) and the factors which affect precipitation (prevailing winds, mountain ranges, and seasonal winds) in those two cities. Step One: Weather Log for St. Louis My City: St. Louis, Missouri Zip Code: http://maps.huge.info/zip.htm Latitude and Longitude: http://www.worldatlas.com/aatlas/imageg.htm Climate Region: http://www.physicalgeography.net/fundamentals/7v.html http://www.geography.learnontheinternet.co.uk/topics/climatezones.html Time Zone: Insert a map of St. Louis here Be sure to cite your source Below, describe how factors which affect temperature (latitude, altitude, distance from water, and ocean currents) and factors which affect precipitation (prevailing winds, mountain ranges, and seasonal winds) impact the weather we have in St. Louis. St. Louis’s location... Resources: http://www.nasa.gov/mission_pages/noaan/climate/climate_weather.html#.VQcybo7F-So http://www.bbc.co.uk/schools/gcsebitesize/geogra phy/weather_climate/climate_rev3.shtml http://www.crh.noaa.gov/Image/dvn/downloads/Cli m_MO_01.pdf For 10 class periods, record the weather information for St. Louis. http://www.weather.com/ or http://forecast.weather.gov/MapClick.php?lat=38.64&lon=90.23#.VQgdNI7F-So DATE TIME TEMP C or F Relative Humidity % Wind Speed MPH Wind Direction Pressure Current Conditions Graph your gathered data using the website: http://nces.ed.gov/nceskids/createagraph/ See shared document: Graphing Your Results Insert your finished graph here Step Two: Weather Log for ________________________ Choose a city that is in a different region than St. Louis. Missouri. It can be anywhere in the world as long as it is a different climate region. Chosen City: Zip Code: http://maps.huge.info/zip.htm Latitude and Longitude: http://www.worldatlas.com/aatlas/imageg.htm Climate Region: http://www.physicalgeography.net/fundamentals/7v.html http://www.geography.learnontheinternet.co.uk/topics/climatezones.html Time Zone: Insert a map of chosen city here Be sure to cite your source Below, describe how factors which affect temperature (latitude, altitude, distance from water, and ocean currents) and factors which affect precipitation (prevailing winds, mountain ranges, and seasonal winds) Resources: http://www.nasa.gov/mission_pages/noaan/climate/climate_weather.html#.VQcybo7F-So http://www.bbc.co.uk/schools/gcsebitesize/geo graphy/weather_climate/climate_rev3.shtml impact the weather we have in St. Louis. http://www.crh.noaa.gov/Image/dvn/downloads/ Clim_MO_01.pdf (Chosen City’s) location... For 10 class periods, record the weather information for _________________________. http://www.weather.com/ or http://forecast.weather.gov/MapClick.php?lat=38.64&lon=90.23#.VQgdNI7F-So DATE TIME TEMP C or F Relative Humidity % Wind Speed MPH Wind Direction Pressure Current Conditions Graph your gathered data using the website: http://nces.ed.gov/nceskids/createagraph/ See shared document: Graphing Your Results Insert your finished graph here Graph Self Evaluation Scoring Date: Name: Category Variables Scoring Criteria Points Student Teacher Evaluation Evaluation The independent variable is drawn on the X axis. 1 1 1 The dependent variable is drawn on the Y axis. Both axes are labeled accurately with appropriate units. Graph Title A descriptive (includes information from both axes) title is located above the graph. 1 Graph Data The number scale is appropriate and accurate. 1 1 1 1 1 The categories for data are listed accurately and neatly. The data are plotted accurately. Requirements Name (first and last), date, class period are included. Quality Class: Graph is neat and can be read easily. Color, if used, accents the graph. Total Points Step Three: Comparing and Contrasting Pair up with a partner who has gathered data from another climate region. Using those data, compare and contrast the two cities on this guide. City: City: Location: (lat/long; region) Location: (lat/long; region) Time period of data gathering: Time period of data gathering: Temperature Data: (summarize) Temperature Data: (summarize) What trends or patterns did you find in those data? What trends or patterns did you find in those data? Factors which affect temperature Factors which affect temperature How does the latitude affect the temperatures in this city? How does the latitude affect the temperatures in this city? How does the altitude affect the temperatures in this city? How does the altitude affect the temperatures in this city? How does the distance from water affect the temperatures in this city? How does the distance from water affect the temperatures in this city? How do the ocean currents affect the temperatures in this city? How do the ocean currents affect the temperatures in this city? City: City: Factors which affect precipitation Factors which affect precipitation How do the prevailing winds affect the temperatures in this city? How do the prevailing winds affect the temperatures in this city? How do the mountain ranges affect the temperatures in this city? How do the mountain ranges affect the temperatures in this city? How do the seasonal winds affect the temperatures in this city? How do the seasonal winds affect the temperatures in this city? Differences: Similarities: Differences: Answer these questions: 1. How does the location of the cities make a difference in their weather? 1. How does the season make a difference in their weather? 1. In what ways are those data between the two cities similar? Different? Why or why not? Step Four: Presenting Your Findings You will take your shared data of the two cities and develop a formal writing which compares and contrasts the weather of the two cities. This final part of the project is a shared presentation. Paragraph 1 both partners Description of the project. You are introducing this project to an uninformed reader so be specific about the purpose of the project and summarize what you did. Paragraph 2 __________ Description of city 1 (location, factors which affect temperature and precipitation) and summary of the data. Include the graph of your results. Paragraph 3 __________ Description of city 2 (location, factors which affect temperature and precipitation) and summary of the data. Include the graph of your results. Paragraph 4 both partners Compare and contrast the two cities. What patterns or trends did you find? Paragraph 5 both partners Summarize the project in a closing paragraph. Criterion Mastered 30-26 Proficient 25-17 Emerging 16-8 Basic 7-0 Content Project contains accurate and complete information about each of the two cities (location, factors which affect temperature and precipitation); additional information which enhances the understanding of the reader; and a critical comparison of the factors which affect temperature and precipitation for each city. Content area vocabulary is used accurately and explained well within the text. Project contains accurate and complete information about each of the two cities (location, factors which affect temperature and precipitation); and comparison of the factors which affect temperature and precipitation for each city. Content area vocabulary is used accurately and explained. Project contains mostly accurate and complete information. At least one city is described including some information about location, factors which affect temperature and precipitation. Some attempt is made to compare the weather of the two cities. Project lacks many of the required elements and/or information is incomplete and/or incorrect. Criterion Mastered 7-6 Proficient 5-4 Emerging 3-2 Basic 1-0 Written Product Project is written exceptionally well and conveys information to an uninformed reader for best understanding with few or no grammar or spelling errors. This is an example of above grade level work. Project conveys information well to an uninformed reader with few or no grammar or spelling errors. Project conveys information with some grammar and/or spelling errors. Information is difficult to pick out of the writing due to grammar and/or spelling errors. Organization Writing is organized in an easy to follow, logical order which enhances the understanding of the reader. Pictures and graphs are embedded within the text to which it pertains. Writing is organized in a logical order. Organization enhances the understanding of the reader. Pictures and graphs are located close to the information to which it pertains. Writing is organized in a way that makes the reader sometimes search for information or the connections between information. Pictures and Information is difficult to find or the order is not logical. Your Score Your Score graphs are present. TOTAL /35
