MAT 107 - Southern Connecticut State University
advertisement
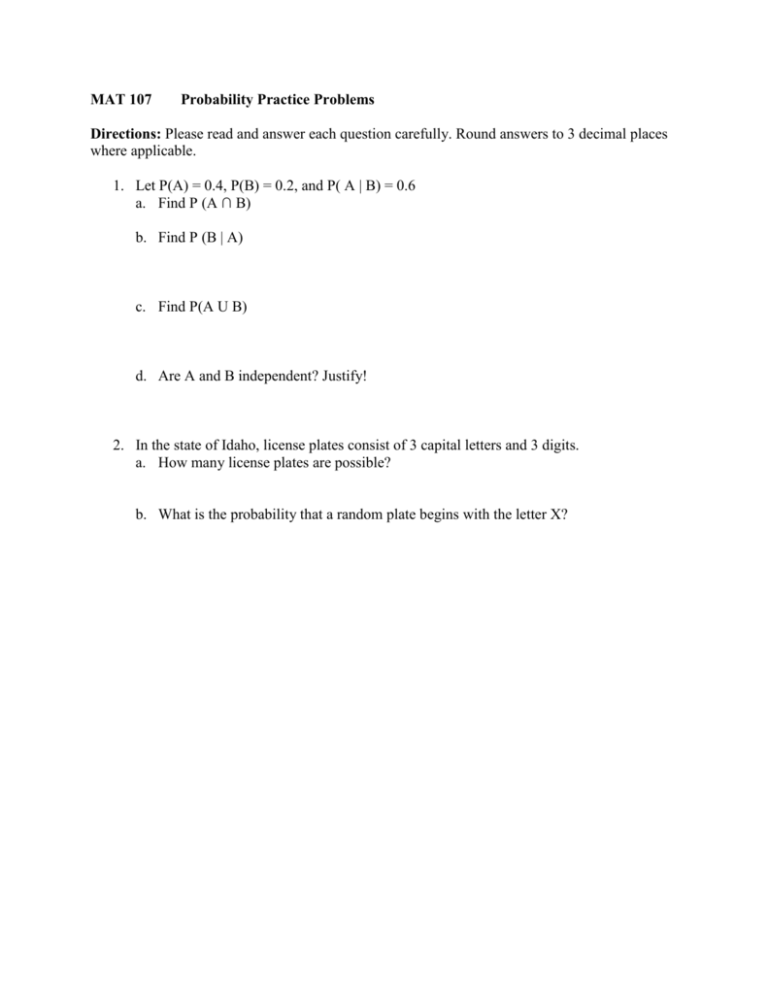
MAT 107 Probability Practice Problems Directions: Please read and answer each question carefully. Round answers to 3 decimal places where applicable. 1. Let P(A) = 0.4, P(B) = 0.2, and P( A | B) = 0.6 a. Find P (A ∩ B) b. Find P (B | A) c. Find P(A U B) d. Are A and B independent? Justify! 2. In the state of Idaho, license plates consist of 3 capital letters and 3 digits. a. How many license plates are possible? b. What is the probability that a random plate begins with the letter X? 3. There are 15 members of the senate available for a committee, 9 are Male and 6 are Female. The committee will have 5 people. Suppose the committee is selected at random. a. Find the probability that the committee consists of 5 Males. b. Find the probability that the committee has at least 1 Female. c. Find the probability that the committee consists of 3 Males and 2 Females. d. If the committee consisted of all Females, would you believe the committee was selected at random? Justify. 4. The following table gives data for a survey given to 100 random commuters and 100 random resident students asking about satisfaction with the university. A random student is selected. Find: a. The probability that the student is a resident given he/she had a high satisfaction. b. The probability that the student had a high satisfaction given he/she is a resident c. Are being a resident and having a high satisfaction independent? Justify Resident Commuter Low 12 48 Middle 30 42 High 58 10 5. Given the following data: 20, 25, 27, 28, 28, 29, 29, 30, 30, 30 a. Find and label the mean and the median. b. What does the relationship between the mean and the median suggest about the symmetry of the data set? 6. A researcher finds that the histogram of her data is mound or bell shaped. She finds that the mean of her data is 92.7 and the standard deviation is 12.5. a. Between what 2 values should approximately 95% of her data fall. b. Would you consider 65 an unusual observation for this data set? Why or why not? c. Give a reasonable value for the median? Why is it reasonable? 7. Postmortem interval is defined as the elapsed time between death and autopsy. The following data are 20 PMI’s. Construct a relative frequency distribution and a relative histogram, using 6 classes of the same width, starting with [3.0, 5.0) 3.3 7.1 3.9 8.0 4.2 8.3 5.0 9.1 6.6 9.2 6.7 9.3 6.8 9.8 6.8 10.6 6.9 10.8 7.0 14.6 8. Make a box and whisker plot for the above data. Be sure to label the plot accurately including any outliers and justify why they are outliers.
