Using GIS for Transportation Analysis
advertisement
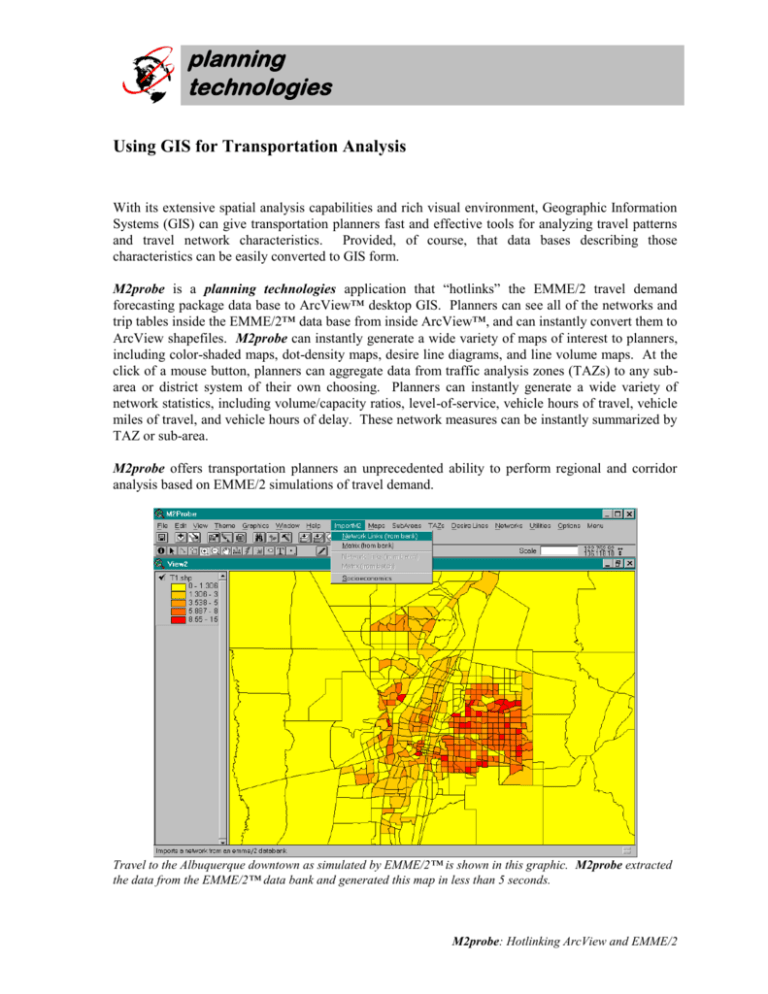
planning technologies Using GIS for Transportation Analysis With its extensive spatial analysis capabilities and rich visual environment, Geographic Information Systems (GIS) can give transportation planners fast and effective tools for analyzing travel patterns and travel network characteristics. Provided, of course, that data bases describing those characteristics can be easily converted to GIS form. M2probe is a planning technologies application that “hotlinks” the EMME/2 travel demand forecasting package data base to ArcView™ desktop GIS. Planners can see all of the networks and trip tables inside the EMME/2™ data base from inside ArcView™, and can instantly convert them to ArcView shapefiles. M2probe can instantly generate a wide variety of maps of interest to planners, including color-shaded maps, dot-density maps, desire line diagrams, and line volume maps. At the click of a mouse button, planners can aggregate data from traffic analysis zones (TAZs) to any subarea or district system of their own choosing. Planners can instantly generate a wide variety of network statistics, including volume/capacity ratios, level-of-service, vehicle hours of travel, vehicle miles of travel, and vehicle hours of delay. These network measures can be instantly summarized by TAZ or sub-area. M2probe offers transportation planners an unprecedented ability to perform regional and corridor analysis based on EMME/2 simulations of travel demand. Travel to the Albuquerque downtown as simulated by EMME/2™ is shown in this graphic. M2probe extracted the data from the EMME/2™ data bank and generated this map in less than 5 seconds. M2probe: Hotlinking ArcView and EMME/2 planning technologies The Application The application is distributed as an Arcview™ extension and associated DLLs which can be attached to any Arcview project, instantly giving Arcview™ the ability to see inside the EMME/2™ data bank and extract network and matrix data. M2probe runs on Windows95/NT™ platforms, and is also available for unix. M2probe extracts data from the EMME/2™ data bank directly – batch out files are not needed. This gives the planner a superior transportation analysis platform: can extract any portion of full matrix data, such as trips to the central business district, “on the fly” by merely clicking on the TAZs of interest. Zone group ensembles and other clumsy mechanisms inherent to EMME/2™ are bypassed. The Implementation m2probe was implemented in Arcview’s™ scripting language Avenue™. Also, the application consists of Visual-BASIC™ programs and Visual C++™ programs, both from Microsoft™. The application code was developed by planning technologies, and is proprietary. The planner can bring transfer EMME/2™ data to ArcView without leaving the ArcView environment. It’s fast. Extraction of a 6,000 link network and conversion to an ArcView™ shape file takes approximately 45 seconds on a 120 mhz Pentium class computer. More importantly, the planner can access data not normally generated in EMME/2 batch files, such as VOLAU and TIMAU variables. One of m2probe’s impressive features is its ability to convert networks in a variety of ways. Planners can choose, if they desire, to ignore load links, which often play no role in travel analysis. At the planner’s choosing, EMME/2’s™ internal 1-way representation of roadway links can be collapsed to 2-way representation “on the fly”, thereby giving planners an ability to compute total 2-way roadway volumes and other statistics, including directional splits. Before m2probe, there was no way to do this. Another of m2probe’s impressive features is its ability to extract trip table and travel time matrix data from any EMME/2™ data bank and attach it to a TAZ shape file. Planners Desire line diagrams can be instantly generated with m2probe. Other Features In addition to its ability to extract network and matrix data from the EMME/2™ data bank, m2probe provides the planner with extensive capabilities for analyzing and mapping travel forecasting results: Generates color-shaded or random dot density TAZ maps for any variable of interest. Automatically generates desire line “spider” diagrams for any TAZ variable of interest. M2probe: Hotlinking ArcView and EMME/2 planning technologies Automatically converts variables, such as trip origins in TAZs, to density representations, such as trip origins per acre, to more properly depict them on maps. Automatically aggregates TAZ level data to other larger geographies, such as subareas or district systems. Aggregate data can be mapped in almost any way, using color-shaded, dot density, or desire-line techniques. Automatically computes volume/capacity ratios, levels of service, vehicle hours of travel, and a host of other link-based variables, at the click of a button. Automatically summarizes network data by TAZ, district, or sub-area, or any other geographic area of interest. Automatically generates line-volume network maps, which can be color shaded. Automatically precision. rounds data to any Availability m2probe is now in Beta-3 test. M2probe licenses are available for purchase now. Contact us. A line volume map for the Albuquerque network. M2probe: Hotlinking ArcView and EMME/2 planning technologies M2probe: Hotlinking ArcView and EMME/2
