Locus - Wiley
advertisement
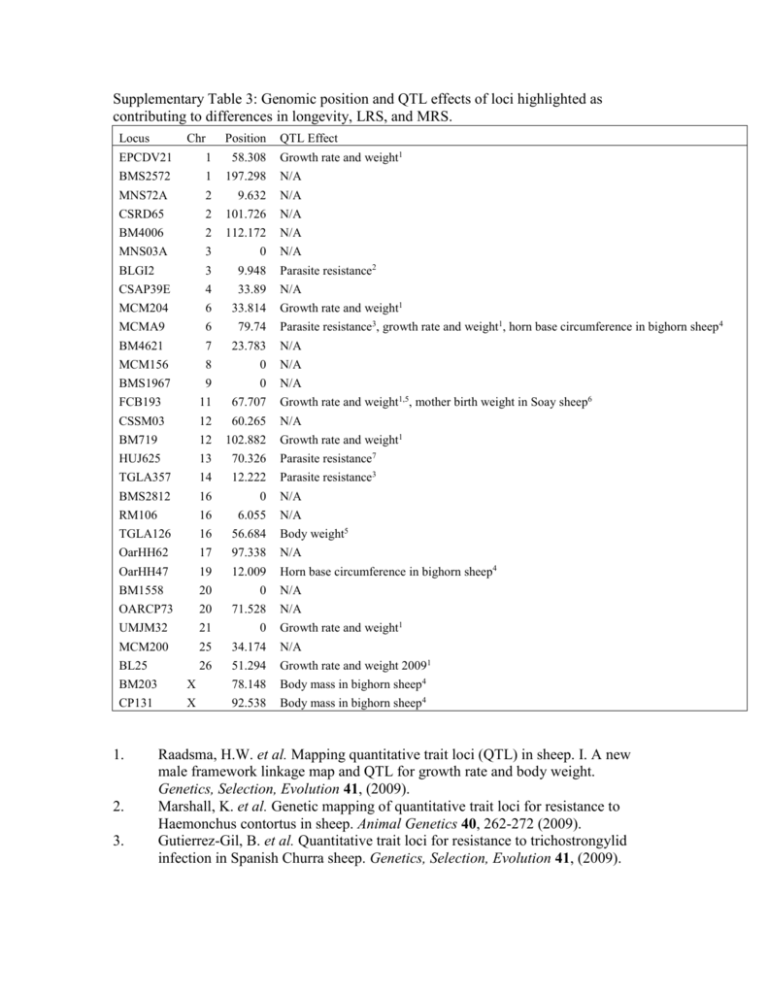
Supplementary Table 3: Genomic position and QTL effects of loci highlighted as contributing to differences in longevity, LRS, and MRS. Locus Chr Position QTL Effect Growth rate and weight1 EPCDV21 1 58.308 BMS2572 1 197.298 N/A MNS72A 2 9.632 N/A CSRD65 2 101.726 N/A BM4006 2 112.172 N/A MNS03A 3 0 N/A BLGI2 3 9.948 Parasite resistance2 CSAP39E 4 33.89 N/A MCM204 6 33.814 MCMA9 6 79.74 BM4621 7 23.783 N/A MCM156 8 0 N/A N/A BMS1967 Growth rate and weight1 Parasite resistance3, growth rate and weight1, horn base circumference in bighorn sheep 4 9 0 FCB193 11 67.707 Growth rate and weight1,5, mother birth weight in Soay sheep6 CSSM03 12 60.265 N/A BM719 12 102.882 HUJ625 13 70.326 Parasite resistance7 TGLA357 14 12.222 Parasite resistance3 BMS2812 16 0 N/A RM106 16 6.055 N/A TGLA126 16 56.684 Body weight5 OarHH62 17 97.338 N/A OarHH47 19 12.009 Horn base circumference in bighorn sheep4 BM1558 20 0 N/A OARCP73 20 71.528 N/A UMJM32 21 0 MCM200 25 34.174 N/A BL25 26 51.294 Growth rate and weight 20091 Growth rate and weight1 Growth rate and weight1 BM203 X 78.148 Body mass in bighorn sheep4 CP131 X 92.538 Body mass in bighorn sheep4 1. 2. 3. Raadsma, H.W. et al. Mapping quantitative trait loci (QTL) in sheep. I. A new male framework linkage map and QTL for growth rate and body weight. Genetics, Selection, Evolution 41, (2009). Marshall, K. et al. Genetic mapping of quantitative trait loci for resistance to Haemonchus contortus in sheep. Animal Genetics 40, 262-272 (2009). Gutierrez-Gil, B. et al. Quantitative trait loci for resistance to trichostrongylid infection in Spanish Churra sheep. Genetics, Selection, Evolution 41, (2009). 4. 5. 6. 7. 8. 9. 10. 11. 12. Poissant, J., Davis, C.S., Malenfant, R., Hogg, J.T. & Coltman, D.W. QTL mapping for sexually dimorphic fitness-related traits in wild bighorn sheep. (In prep). Cavanagh, C.R. et al. Mapping Quantitative Trait Loci (QTL) in sheep. III. QTL for carcass composition traits derived from CT scans and aligned with a metaassembly for sheep and cattle carcass QTL. Genetics, Selection, Evolution 42, (2010). Beraldi, D. et al. Mapping quantitative trait loci underlying fitness-related traits in a free-living sheep population. Evolution 61, 1403-1416 (2007). Beh, K.J. et al. A genome scan for quantitative trait loci affecting resistance to Trichostrongylus colubriformis in sheep. Animal Genetics 33, 97-106 (2002). Gutierrez-Gil, B. et al. Quantitative trait loci for resistance to trichostrongylid infection in Spanish Churra sheep. Genetics Selection Evolution 41, doi:10.1186/1297-9686-41-46 (2009). Silva, M.V.B. et al. Identification of quantitative trait loci affecting resistance to gastrointestinal parasites in a double backcross population of Red Maasai and Dorper sheep. Animal Genetics (In press). Beraldi, D. et al. Quantitative trait loci (QTL) mapping of resistance to strongyles and coccidia in the free-living Soay sheep (Ovis aries). International Journal for Parasitology 37, 121-129 (2007). Johnston, S.E., Beraldi, D., McRae, A.F., Pemberton, J.M. & Slate, J. Horn type and horn length genes map to the same chromosomal region in Soay sheep. Heredity 104, 196-205 (2010). Davies, G. et al. Quantitative trait loci associated with parasitic infection in Scottish blackface sheep. Heredity 96, 252-258 (2006).
