Revised Core Jail Outcome Measures
advertisement
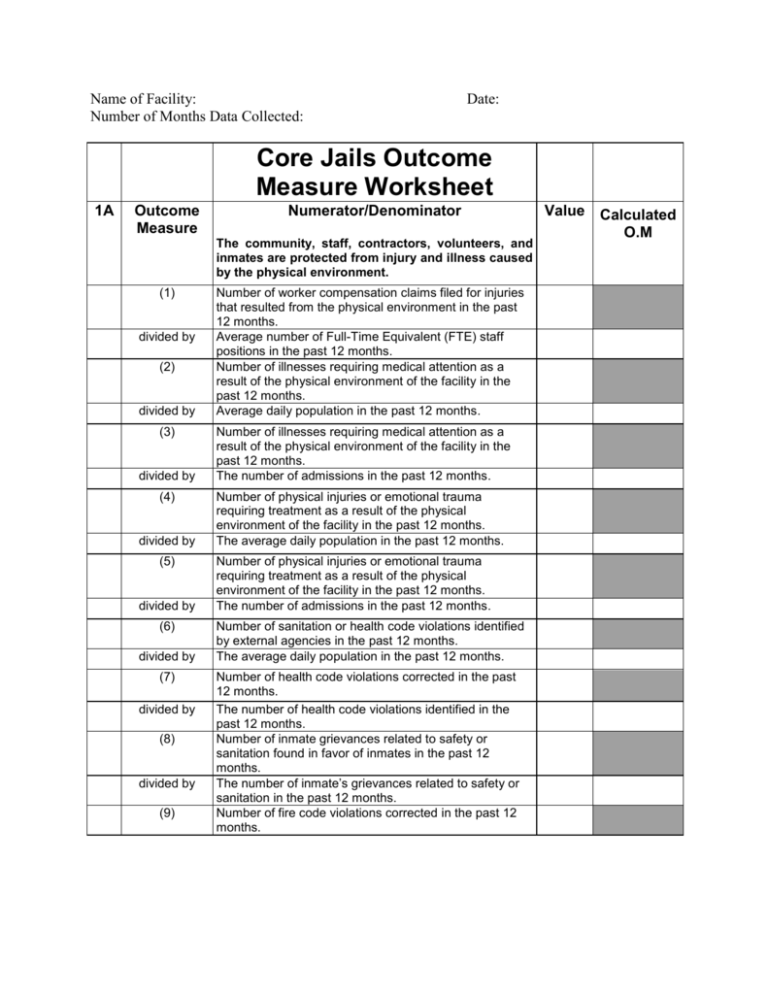
Name of Facility: Number of Months Data Collected: Date: Core Jails Outcome Measure Worksheet 1A Outcome Measure Numerator/Denominator The community, staff, contractors, volunteers, and inmates are protected from injury and illness caused by the physical environment. (1) divided by (2) divided by (3) divided by (4) divided by (5) divided by (6) divided by (7) divided by (8) divided by (9) Number of worker compensation claims filed for injuries that resulted from the physical environment in the past 12 months. Average number of Full-Time Equivalent (FTE) staff positions in the past 12 months. Number of illnesses requiring medical attention as a result of the physical environment of the facility in the past 12 months. Average daily population in the past 12 months. Number of illnesses requiring medical attention as a result of the physical environment of the facility in the past 12 months. The number of admissions in the past 12 months. Number of physical injuries or emotional trauma requiring treatment as a result of the physical environment of the facility in the past 12 months. The average daily population in the past 12 months. Number of physical injuries or emotional trauma requiring treatment as a result of the physical environment of the facility in the past 12 months. The number of admissions in the past 12 months. Number of sanitation or health code violations identified by external agencies in the past 12 months. The average daily population in the past 12 months. Number of health code violations corrected in the past 12 months. The number of health code violations identified in the past 12 months. Number of inmate grievances related to safety or sanitation found in favor of inmates in the past 12 months. The number of inmate’s grievances related to safety or sanitation in the past 12 months. Number of fire code violations corrected in the past 12 months. Value Calculated O.M divided by (10) divided by (11) divided by (12) divided by (13) divided by (14) divided by 1B (1) divided by (2) divided by (3) divided by (4) divided by (5) divided by (6) divided by (7) The number of fire code violations cited by jurisdictional authority in the past 12 months. Number of inmate injuries resulting from fires requiring medical treatment in a 12-month period. The average daily population in the past 12 months. Number of inmate injuries (other than by fire) requiring medical treatment in the past 12 months. The average daily population of inmates in the past 12 months. Number of staff injuries resulting from fires requiring medical treatment in the past 12 months. The average daily population of staff in the past 12 months. Number of staff injuries (other than fire) requiring medical treatment in the past 12 months. The average daily population of staff in the past 12 months. Number of inmate lawsuits related to safety or sanitation found in favor of the inmate in the past 12 months. The number of inmate lawsuits related to safety or sanitation in the past 12 months. The number and severity of emergencies are minimized. When emergencies occur, the response minimizes the severity. Number of emergencies, caused by forces external to the facility, that result in property damage in the past 12 months. The number emergencies. Number of injuries, caused by forces external to the facility, requiring medical attention that resulted from emergencies in the past 12 months. The average daily population in the past 12 months. Number of times that normal facility operations were suspended due to emergencies caused by forces external to the facility in the past 12 months. The average daily population in the past 12 months. Number of hours that facility operations were suspended due to emergencies caused by forces external to the facility in the past 12 months. The number of emergencies caused by forces external to the facility. Number of emergencies that were not caused by forces external to the facility that resulted in property damage in the past 12 months. The average daily population in the past 12 months. Number of injuries requiring medical attention that resulted from emergencies that were not caused by forces external to the facility in the past 12 months. The average daily population in the past 12 months. Number of times that normal facility operations were suspended due to emergencies that were not caused by divided by (8) divided by (9) divided by (10) divided by (11) divided by (12) divided by (13) divided by (14) divided by 2A Outcome Measure (1) divided by (2) divided by (3) divided by (4) divided by (5) divided by (6) divided by 2B forces external to the facility in the past 12 months. The average daily population in the past 12 months. Number of hours that facility operations were suspended due to emergencies that were not caused by forces external to the facility in the past 12 months. The number of emergencies. Number of injuries resulting from fires requiring medical treatment in the past 12 months. The average daily population in the past 12 months. Number of fires that resulted in property damage in the past 12 months. The average daily population in the past 12 months. Amount dollar of property damage from fire in the past 12 months. The average daily population in the past 12 months. Number of code violations cited in the past 12 months. The average daily population in the past 12 months. Number of incidents involving toxic or caustic materials in the past 12 months. The average daily population in the past 12 months. Number of incidents of inventory discrepancies in the past 12 months. The average daily population in the past 12 months. Numerator/Denominator The community, staff, contractors, volunteers, and inmates are protected from harm. Events that pose risk of harm are prevented. The number and severity of events are minimized. Number of incidents involving harm in the past 12 months. The average daily population in the past 12 months. Number of incidents in the past 12 months involving harm. The number of admissions in the past 12 months. Number of physical injuries or emotional trauma requiring treatment as a result of incidents in the past 12 months. The average daily population in the past 12 months. Number of physical injuries or emotional trauma requiring treatment as a result of the incidents in the past 12 months. The number of admissions in the past 12 months. Number of unauthorized inmate absences from the facility in the past 12 months. The average daily population in the past 12 months. Number of instances of unauthorized access to the facility in the past 12 months. The average daily population in the past 12 months. Physical force is used only in instances of selfprotection, protection of the inmate or others, prevention of property damage, or prevention of Value Calculated O.M (1) divided by (2) divided by (3) divided by (4) divided by (5) divided by (6) divided by 2C (1) divided by (2) divided by (3) divided by (4) divided by (5) divided by 2D (1) divided by (2) divided by (3) divided by (4) divided by 3A escape. Number of instances in which force was used in the past 12 months. The average daily population in the past 12 months. Number of instances in which force was used in the past 12 months. The number of admissions in the past 12 months. Number of times that staff use of force were found to have been inappropriate in the past 12 months. The number of instances in which force was used. Number of inmate grievances filed alleging inappropriate use of force in the past 12 months. The average daily population in the past 12 months. Number of grievances alleging inappropriate use of force decided in favor of inmate in the past 12 months. The number of grievances alleging inappropriate use of force filed. Number of injuries requiring medical treatment resulting from staff use of force in the past 12 months. The average daily population in the past 12 months. Contraband is minimized. It is detected when present in the facility. Number of incidents involving contraband in the past 12 months. The average daily population in the past 12 months. Number of incidents involving contraband in the past 12 months. The number of admissions in the past 12 months. Number of weapons found in the facility in the past 12 months. The average daily population in the past 12 months. Number of controlled substances found in the facility in the past 12 months. The average daily population in the past 12 months. Number of controlled substances found in the facility in the past 12 months. The number of admissions in the past 12 months. Improper access to and use of keys, tools and utensils are minimized. Number of incidents involving keys in the past 12 months. The average daily population in the past 12 months. Number of incidents involving tools in the past 12 months. The average daily population in the past 12 months. Number of incidents involving culinary equipment in the past 12 months. The average daily population in the past 12 months. Number of incidents involving medical equipment and sharps in the past 12 months. The average daily population in the past 12 months. Inmates comply with rules and regulations. (1) divided by (2) divided by 4A (1) divided by (2) divided by (3) 4B (1) divided by (2) divided by (3) divided by (4) divided by (5) divided by 4C (1) divided by (2) divided by (3) divided by Number of rule violations in the past 12 months. The average daily population in the past 12 months. Number of assaults—inmate against inmate, inmate against staff in the past 12 months. The average daily population in the past 12 months. Food service provides a nutritionally balanced diet. Food service operations are hygienic and sanitary. Number of documented inmate illnesses attributed to food service operations in the past 12 months. The average daily population in the past 12 months. Number of inmate grievances about food service decided in favor of the inmate the past 12 months. The number of inmate grievances about food service in the past 12 months. Number of violations cited by independent authorities for food service sanitation in the past 12 months. Divided by number of violations cited by independent authorities in the past 12 months. Inmates maintain acceptable personal hygiene practices. Inmate grievances regarding inmate access to personal hygiene decided in favor of the inmate in the past 12 months. The average daily population in the past 12 months. Number of inmate illnesses attributed to poor hygiene practices in the past 12 months. The average daily population in the past 12 months. Number of inmates diagnosed with hygiene-related conditions (scabies, lice, or fungal infections) in the past 12 months. The average daily population in the past 12 months. Number of inmate grievances related to hygiene found in favor of the inmate in the past 12 months. The number of inmate grievances related to hygiene in the past 12 months. Number of inmate lawsuits related to hygiene found in favor of the inmate in the past 12 months. The number of inmate lawsuits related to hygiene in the past 12 months. Inmates maintain good health. Inmates have unimpeded access to a continuum of health care services so that their health care needs, including prevention and health education, are met in a timely and efficient manner. Number of inmates with a positive tuberculin skin test in the past 12 months. The number of admissions in the past 12 months. Number of inmates diagnosed with active tuberculosis in the past 12 months. The average daily population in the past 12 months. Number of conversions to a positive tuberculin skin test in the past 12 months. The number of tuberculin skin tests given in the past 12 (4) divided by (5) divided by (6) divided by (7) divided by (8) divided by (9) divided by (10) divided by (11) divided by (12) divided by (13) divided by (14) divided by (15) divided by (16) divided by (17) divided by (18) divided by (19) months. Number of inmates with a positive tuberculin skin test who completed prophylaxis treatment for tuberculosis in the past 12 months. The number of inmates with a positive tuberculin skin test on prophylaxis treatment for tuberculosis in the past 12 months. Number of Hepatitis C positive inmates in the past 12 months. The average daily population in the past 12 months. Number of HIV positive inmates in the past 12 months. The average daily population in the past 12 months. Number of HIV positive inmates who are being treated with highly active antiretroviral treatment in the past 12 months. The number of known HIV positive inmates in the past 12 months. Number of inmates’ diagnosis with an Axis I (excluding sole diagnosis of substance abuse) in the past 12 months. The average daily population in the past 12 months. Number of inmate suicide attempts in the past 12 months. The average daily population in the past 12 months. Number of inmate suicides in the past 12 months. The average daily population in the past 12 months. Number of inmate deaths due to homicide in the past 12 months. The average daily population in the past 12 months. Number of inmate deaths due to injuries in the past 12 months. The average daily population in the past 12 months. Number of medically expected inmate deaths in the past 12 months. The average daily population in the past 12 months. Number of medically unexpected inmate deaths in the past 12 months. The average daily population in the past 12 months. Number of inmate admissions to the infirmary (where available) in the past 12 months. The average daily population in the past 12 months. Number of inmate admissions to off-site hospitals in the past 12 months. The average daily population in the past 12 months. Number of inmates transported off-site (via an ambulance or correctional vehicle) for treatment of emergency health conditions in the past 12 months. The average daily population in the past 12 months. Number of inmate specialty consults completed in the past 12 months. The number of specialty consults (on-site or off-site) ordered by primary health care provider (MD, NP, PA) in the past 12 months. Number of inmate grievances about access to health care services found in favor of the inmate in the past 12 divided by (20) divided by (21) divided by (22) divided by (23) divided by (24) divided by (25) divided by (26) divided by (27) divided by (28) divided by (29) divided by (30) divided by (31) divided by (32) divided by (33) divided by (34) months. The number of inmate grievances about access to healthcare services in the past 12 months. Number of inmate grievances related to the quality of health care found in favor of inmates in the past 12 months. The number of inmate grievances related to the quality of health care in the past 12 months. Number of inmates’ lawsuits about access to healthcare services found in favor of inmates in the past 12 months. The number of inmate’s lawsuits about access to healthcare services in the past 12 months. Number of individual sick call encounters in the past 12 months. The average daily population in the past 12 months. Number of physician visits contacts in the past 12 months. The average daily population in the past 12 months. Number of individualized dental treatment plans in the past 12 months. The average daily population in the past 12 months. Number of hypertensive inmates enrolled in a chronic care clinic in the past 12 months. The average daily population in the past 12 months. Number of diabetic inmates enrolled in a chronic care clinic in the past 12 months. The average daily population in the past 12 months. Number of incidents involving pharmaceuticals as contraband in the past 12 months. The average daily population in the past 12 months. Number of cardiac diets received by inmates with cardiac disease in the past 12 months. The number of cardiac diets prescribed in the past 12 months. Number of hypertensive diets received by inmates with hypertension in the past 12 months. The number of hypertensive diets prescribed in the past 12 months. Number of diabetic diets received by inmates with diabetes in the past 12 months. The number of diabetic diets prescribed in the past 12 months. Number of renal diets received by inmates with renal disease in the past 12 months. The number of renal diets prescribed in the past 12 months. Number of needle-stick injuries in the past 12 months. The number of employees on average in the past 12 months. Number of pharmacy dispensing errors in the past 12 months. The number of prescriptions dispensed by the pharmacy in the past 12 months. Number of nursing medication administration errors in the past 12 months. 4D 5A divided by The number of medications administered in the past 12 months. Health services are provided in a professionally acceptable manner. Staff are qualified, adequately trained, and demonstrate competency in their assigned duties. (1) Number of staff with lapsed licensure and/or certification in the past 12 months. divided by The number of licensed or certified staff in the past 12 months. (2) Number of new employees in the past 12 months who completed orientation training prior to undertaking job assignments. divided by The number of new employees in the past 12 months. (3) Number of employees completing in-service training requirements in the past 12 months. divided by The number of employees eligible in the past 12 months. (4) Number of MD staff who left employment in the past 12 months. divided by The number of authorized MD staff positions in the past 12 months. (5) Number of RN staff who left employment in the past 12 months. divided by The number of authorized RN staff positions in the past 12 months. (6) Number of LPN staff who left employment in the past 12 months. divided by The number of authorized LPN staff positions in the past 12 months. (7) Number of medical records staff who left employment in the past 12 months. divided by The number of medical records staff positions in the past 12 months. (8) Number of alleged sexual misconduct incidents between staff and detainees in the past 12 months. divided by Average daily population in the past 12 months. (9) Number of alleged sexual misconduct incidents between volunteers and/or contract personnel and detainees in the past 12 months. divided by Average daily population in the past 12 months. (10) Number of confirmed sexual misconduct incidents between staff and detainees in the past 12 months. divided by Average daily population in the past 12 months. (11) Number of confirmed sexual misconduct incidents between volunteers and/or contact personnel and detainees in the past 12 months. divided by Average daily population in the past 12 months. (12) Number of detainees identified as high risk with a history of sexually assaultive behavior in the past 12 months. divided by Average daily population in the past 12 months. (13) Number of detainees identified as at risk for sexual victimization in the past 12 months. divided by Average daily population in the past 12 months. Inmates have opportunities to improve themselves (1) divided by (2) divided by (3) divided by 5B 5C while confined. Number of inmates who passed GED exams while confined in the past 12 months. The number of inmates who were sentenced to the jail for 6 months or more in the past 12 months. Total number of grade levels advanced by inmates in the past 12 months. The number of inmates who were sentenced to the jail for 6 months or more in the past 12 months. Number of certificates of vocational competency awarded to inmates in the past 12 months. The number of inmates who were sentenced to the jail for 6 months or more in the past 12 months. Inmates maintain ties with their families and the community. NONE The negative impact of confinement is reduced. NONE 6A (1) divided by (2) divided by (3) divided by (4) divided by 6B (1) divided by (2) divided by (3) divided by (4) divided by (5) Inmates’ rights are not violated. Total number of inmate grievances in the past 12 months, regarding: (a) access to court; (b) mail or correspondence; (c) sexual harassment; (d) discipline; (e) discrimination; (f) protection from harm. The average daily population in the past 12 months. Number of inmate grievances (see [a] through [e] above) decided in favor of inmates in the past 12 months. The total number of grievances filed in the past 12 months. Total number of inmate court suits alleging violation of inmate rights filed against the facility in the past 12 months. The average daily population in the past 12 months. Number of inmate court suits alleging violation of inmate rights decided in favor of inmates in the past 12 months. The total number of inmate suits filed in the past 12 months. Inmates are treated fairly. Number of inmate grievances regarding discrimination in the past 12 months. The average daily population in the past 12 months. Number of inmate grievances regarding discrimination resolved in favor of inmates in the past 12 months. The total number of inmate grievances filed regarding discrimination in the past 12 months. Number of grievances resolved in favor of inmates in the past 12 months. The average daily population in the past 12 months. Number of grievances resolved in favor of inmates in the past 12 months. The total number of inmate grievances filed in the past 12 months. Number of court malpractice or torte liability cases found in favor of the inmate in the past 12 months. divided by 6C (1) divided by (2) divided by (3) divided by (4) divided by (5) divided by (6) divided by (7) divided by (8) divided by (9) divided by 7A (1) divided by (2) divided by (3) divided by (4) divided by The number of court malpractice or torte liability cases in the past 12 months. Alleged rule violations are handled in a manner that provides inmates with appropriate procedural safeguards. Number of disciplinary incidents resolved informally in the past 12 months. The average daily population in the past 12 months. Number of formal inmate disciplinary decisions that were appealed in the past 12 months. The total number of disciplinary decisions made in the past 12 months. Number of appealed disciplinary decisions decided in favor of the inmate in the past 12 months. The total number of disciplinary decisions made in the past 12 months. Number of grievances filed by inmates challenging disciplinary procedures in the past 12 months. The average daily population in the past 12 months. Number of disciplinary-related grievances resolved in favor of the inmate in the past 12 months. The total number of disciplinary-related grievances filed in the past 12 months. Number of court suits filed against the facility regarding discipline in the past 12 months. The average daily population in the past 12 months. Number of court cases regarding discipline decided against the facility in the past 12 months. The total number of court decisions regarding discipline decided in the past 12 months. Number of rule violations in the past 12 months. The average daily population in the past 12 months. Number of inmates terminated from the facility due to rule violations in the past 12 months. The average daily population in the past 12 months. Staff, contractors, and volunteers demonstrate competency in their assigned duties. Total number of years of staff members’ education as of the end of the last calendar year. The number of staff at the end of the last calendar year. Number of staff who left employment for any reason in the past 12 months. The number of full-time equivalent staff positions in the past 12 months. Total number of credit hours in course relevant to their facility responsibilities earned by staff participating in higher education in the past 12 months. The number of full-time equivalent staff positions in the past 12 months. Number of professional development events attended by staff in the past 12 months. The number of full-time equivalent staff positions in the 7B (1) divided by (2) divided by (3) divided by (4) divided by (5) divided by (6) divided by (7) divided by (8) divided by (9) divided by (10) divided by 7C (1) divided by (2) (3) divided by (4) past 12 months. Staff, contractors, and volunteers are professional, ethical and accountable. Number of incidents in which staff was found to have acted in violation of facility policy in the past 12 months. The number of full-time equivalent staff positions in the past 12 months. Number of staff terminated for conduct violations in the past 12 months. The number of full-time equivalent staff positions in the past 12 months. Number of inmate grievances attributed to improper staff conducts which were upheld in the past 12 months. The number of inmate grievances alleging improper staff conduct filed in the past 12 months. Number of inmate grievances attributed to improper staff conduct which were upheld in the past 12 months. The average daily population for the past 12 months. Where staff is tested, the number of staff substance abuse tests failed in the past 12 months. The number of staff substance abuse tests administered in the past 12 months. Number of staff terminations for violation of drug-free work policy in the past 12 months. The number of staff terminations in the past 12 months. The average number of physicians employed in the past 12 months. The number of physician positions authorized in the past 12 months. The average number of nurses employed in the past 12 months. The number of nurse positions authorized in the past 12 months. The average number of mid-level health care practitioners employed in the past 12 months. The number of mid-level health care practitioner positions authorized in the past 12 months. The average number of ancillary health care staff employed in the past 12 months. The number of ancillary health care staff positions authorized in the past 12 months. The facility is administered efficiently and responsibly. Net amount of budget shortfalls or surplus at the end of the last fiscal year (budget less expenditures). The budget for the past 12 months. Number of material audit findings by an independent financial auditor at the conclusion of the last audit. NONE Number of grievances filed by inmates regarding their records or property in the past 12 months. The average daily population in the past 12 months. Number of inmate grievances (records/property) decided in favor of inmates in the past 12 months. divided by (5) divided by (6) divided by (7) divided by 7D (1) divided by (2) divided by (3) divided by (4) divided by 7E (1) divided by (2) divided by (3) divided by (4) divided by (5) divided by (6) divided by The total number of inmate grievances (records/property) in the past 12 months. Number of objectives achieved in the past 12 months. The number of objectives for the past 12 months. Number of program changes made in the past 12 months. The number of program changes recommended in the past 12 months. Number of problems identified by internal health care review that were corrected in the past 12 months. The number of problems identified by internal health care review in the past 12 months. Staff are treated fairly. Number of grievances filed by staff in the past 12 months. The number of full-time equivalent staff positions in the past 12 months. Number of staff grievances decided in favor of staff in the past 12 months. The total number of staff grievances in the past 12 months. Total number of years of staff members’ experience in the field as of the end of the last calendar year. The number of staff at the end of the last calendar year (e.g. average number of years experience). Number of staff termination or demotion hearings in which the facility decision was upheld in the past 12 months. The number of staff termination or demotion hearings requested in the past 12 months. The facility is a responsible member of the community. Total number of hours of volunteer service delivered by members of the community in the past 12 months. The average daily population of inmates in the past 12 months. Total number of individual community members who provided voluntary service in the past 12 months. The average daily population of inmates in the past 12 months. Total number of complaints filed by media regarding access to information in the past 12 months. The average daily population of inmates in the past 12 months. Total number of positive statements made by media regarding the facility in the past 12 months. The average daily population of inmates in the past 12 months. Total number of complaints from the community in the past 12 months. The average daily population of inmates in the past 12 months. Total number of hours of community service work delivered by inmates in the past 12 months. The average daily population of inmates in the past 12 months.
