Problem 1
advertisement
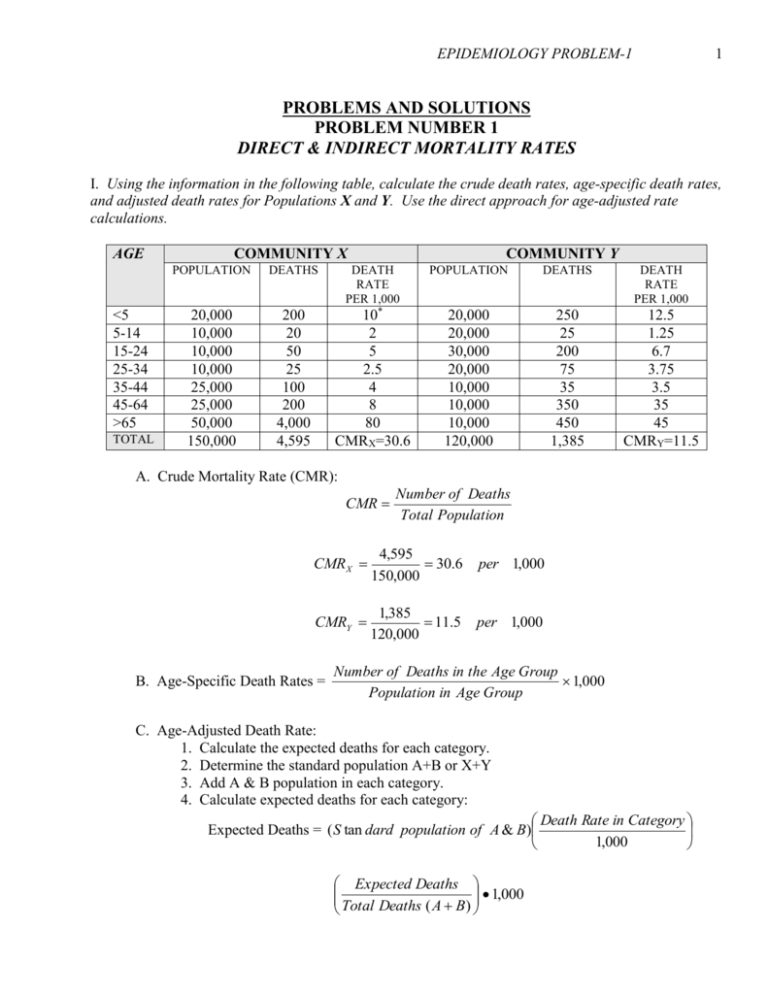
EPIDEMIOLOGY PROBLEM-1 1 PROBLEMS AND SOLUTIONS PROBLEM NUMBER 1 DIRECT & INDIRECT MORTALITY RATES I. Using the information in the following table, calculate the crude death rates, age-specific death rates, and adjusted death rates for Populations X and Y. Use the direct approach for age-adjusted rate calculations. AGE <5 5-14 15-24 25-34 35-44 45-64 >65 TOTAL COMMUNITY X COMMUNITY Y POPULATION DEATHS DEATH RATE PER 1,000 POPULATION DEATHS DEATH RATE PER 1,000 20,000 10,000 10,000 10,000 25,000 25,000 50,000 150,000 200 20 50 25 100 200 4,000 4,595 10* 2 5 2.5 4 8 80 CMRX=30.6 20,000 20,000 30,000 20,000 10,000 10,000 10,000 120,000 250 25 200 75 35 350 450 1,385 12.5 1.25 6.7 3.75 3.5 35 45 CMRY=11.5 A. Crude Mortality Rate (CMR): CMR Number of Deaths Total Population CMR X 4,595 30.6 150,000 per 1,000 CMRY 1,385 11.5 120,000 per 1,000 B. Age-Specific Death Rates = Number of Deaths in the Age Group 1,000 Population in Age Group C. Age-Adjusted Death Rate: 1. Calculate the expected deaths for each category. 2. Determine the standard population A+B or X+Y 3. Add A & B population in each category. 4. Calculate expected deaths for each category: Death Rate in Category Expected Deaths = ( S tan dard population of A & B) 1,000 Expected Deaths 1,000 Total Deaths ( A B) EPIDEMIOLOGY PROBLEM-1 2 5. Calculating an Age-Adjusted Death Rate(AADR) for A & B: AGE <5 5-14 15-24 25-34 35-44 45-64 65+ TOTAL AGE-ADJUSTED DEATH RATE FOR A & B POPULATION DEATH EXPECTED DEATH RATE A+B RATE OF A DEATH OF B RATE OF A 40,000 10 400 12.5 30,000 2 60 1.3 40,000 5 200 6.7 30,000 2.5 75 3.8 35,000 4 140 3.5 35,000 8 280 35 60,000 80 4,800 45 270,000 112 5,955 11.5 a. AADRA = 5,955 1,000 22 per 1,000 2% 270,000 b. AADRB = 4,964.2 1,000 18.38 per 1,000 2% 270,000 EXPECTED DEATH RATE OF B 500 37.5 266.7 112.5 122.5 1,225 2,700 4,964.2 II. Waterville County vital statistics records indicated that there were 3,790 live births in 1992, compared to 3,334 live births in 1990. In 1992 there were 10 more neonatal deaths and 17 more infant deaths than in 1990. In 1990 there were 70 neonatal deaths and 80 infant deaths. Calculate neonatal and infant mortality rates (per 1,000) for Waterville Country for 1990 and 1992. III. Use the following standard death rates to calculate standardized mortality ratios (SMR) for Green City and Red City. How doe standardized mortality ratios compare to crude death rates for Green City and Red City? There were 4,050 deaths in green City and 30,025 deaths in red City. AGE STANDARD DEATH RATES POPULATION GREEN CITY (X) EXPECTED DEATHS GREEN CITY (X) POPULATION RED CITY (Y) EXPECTED DEATHS RED CITY (Y) <1 1-4 5-14 15-24 25-34 35-44 45-54 55-64 >65 15 1 2 1.5 1 2.5 8 10 60 6,000 7,000 7,000 7,000 10,000 10,000 13,000 15,000 25,000 100,000 90 7 14 10.5 10 25 104 150 1,500 1,910.5 50,000 75,000 25,000 30,000 70,000 25,000 20,000 20,000 20,000 335,000 750 75 50 45 70 62.5 160 200 1,200 2,612.5 TOTAL EPIDEMIOLOGY PROBLEM-1 3 A. There are 4,050 deaths in community X (Green City). There are 30,025 deaths in community Y (Red City). B. Crude Mortality Rates (CMR): 1. CMRx Total Deaths 4,050 x 1,000 40.5 Total Population 100,000 per 1,000 2. CMRy Total Deaths 30,025 x 1,000 89.6 Total Population 335,000 per 1,000 3. Crude Mortality Rate does not show much—only that one is 2 times higher than the other. More inferences can be made using the Standardized Mortality Ration (SMR). C. Standardized Mortality Rates (SMR): 1. SMRx Number Observed Deaths 4,050 2.12 Expected Deaths 1,910.5 per 1,000 2. The Green City death rate is 2 times higher than the standard rate 3. SMRY 30,025 11.49 2,612.5 per 1,000 4. The Red City death rate is 5 times higher than the Green City rate and 11.9 times higher than the standard rate.
