Cohort - BioMed Central
advertisement
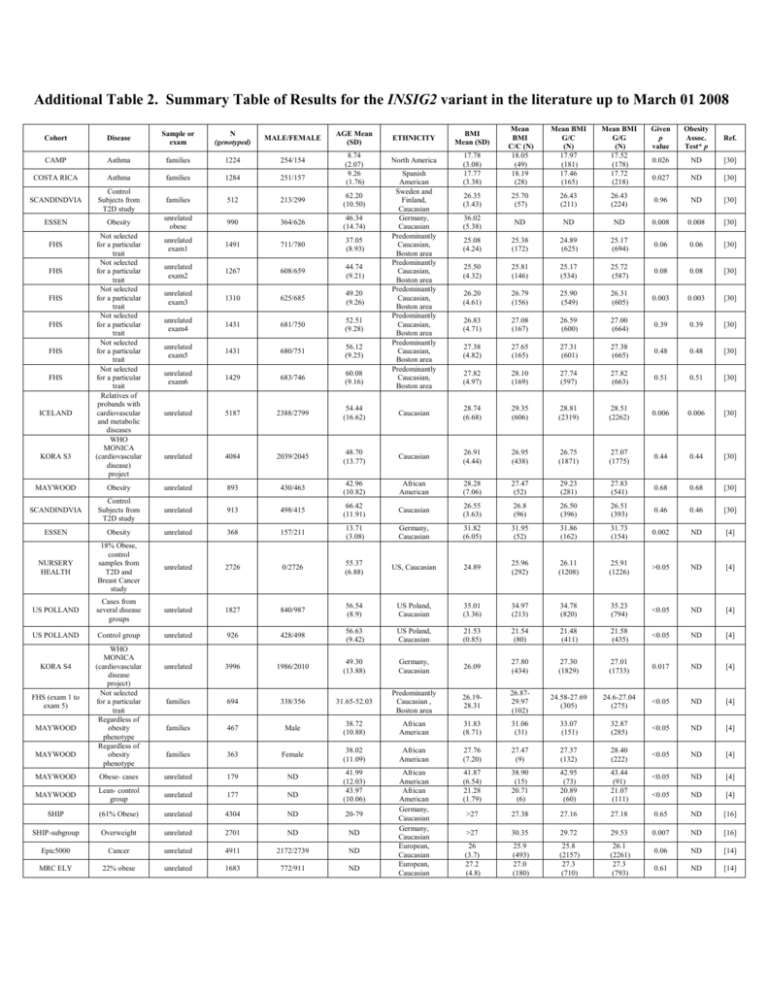
Additional Table 2. Summary Table of Results for the INSIG2 variant in the literature up to March 01 2008 Given p value Obesity Assoc. Test* p Ref. 0.026 ND [30] 0.027 ND [30] 26.43 (224) 0.96 ND [30] ND ND 0.008 0.008 [30] 25.38 (172) 24.89 (625) 25.17 (694) 0.06 0.06 [30] 25.50 (4.32) 25.81 (146) 25.17 (534) 25.72 (587) 0.08 0.08 [30] 26.20 (4.61) 26.79 (156) 25.90 (549) 26.31 (605) 0.003 0.003 [30] 26.83 (4.71) 27.08 (167) 26.59 (600) 27.00 (664) 0.39 0.39 [30] 27.38 (4.82) 27.65 (165) 27.31 (601) 27.38 (665) 0.48 0.48 [30] 27.82 (4.97) 28.10 (169) 27.74 (597) 27.82 (663) 0.51 0.51 [30] Caucasian 28.74 (6.68) 29.35 (606) 28.81 (2319) 28.51 (2262) 0.006 0.006 [30] 48.70 (13.77) Caucasian 26.91 (4.44) 26.95 (438) 26.75 (1871) 27.07 (1775) 0.44 0.44 [30] Cohort Disease Sample or exam N (genotyped) MALE/FEMALE CAMP Asthma families 1224 254/154 COSTA RICA Asthma families 1284 251/157 SCANDINDVIA Control Subjects from T2D study families 512 213/299 62.20 (10.50) Obesity unrelated obese 990 364/626 46.34 (14.74) unrelated exam1 1491 711/780 37.05 (8.93) unrelated exam2 1267 608/659 44.74 (9.21) unrelated exam3 1310 625/685 49.20 (9.26) unrelated exam4 1431 681/750 52.51 (9.28) unrelated exam5 1431 680/751 56.12 (9.25) unrelated exam6 1429 683/746 60.08 (9.16) unrelated 5187 2388/2799 54.44 (16.62) unrelated 4084 2039/2045 ESSEN FHS FHS FHS FHS FHS FHS ICELAND KORA S3 Not selected for a particular trait Not selected for a particular trait Not selected for a particular trait Not selected for a particular trait Not selected for a particular trait Not selected for a particular trait Relatives of probands with cardiovascular and metabolic diseases WHO MONICA (cardiovascular disease) project AGE Mean (SD) 8.74 (2.07) 9.26 (1.76) ETHNICITY North America Spanish American Sweden and Finland, Caucasian Germany, Caucasian Predominantly Caucasian, Boston area Predominantly Caucasian, Boston area Predominantly Caucasian, Boston area Predominantly Caucasian, Boston area Predominantly Caucasian, Boston area Predominantly Caucasian, Boston area 17.78 (3.08) 17.77 (3.38) Mean BMI C/C (N) 18.05 (49) 18.19 (28) Mean BMI G/C (N) 17.97 (181) 17.46 (165) Mean BMI G/G (N) 17.52 (178) 17.72 (218) 26.35 (3.43) 25.70 (57) 26.43 (211) 36.02 (5.38) ND 25.08 (4.24) BMI Mean (SD) MAYWOOD Obesity unrelated 893 430/463 42.96 (10.82) African American 28.28 (7.06) 27.47 (52) 29.23 (281) 27.83 (541) 0.68 0.68 [30] SCANDINDVIA Control Subjects from T2D study unrelated 913 498/415 66.42 (11.91) Caucasian 26.55 (3.63) 26.8 (96) 26.50 (396) 26.51 (393) 0.46 0.46 [30] Germany, Caucasian 31.82 (6.05) 31.95 (52) 31.86 (162) 31.73 (154) 0.002 ND [4] ESSEN Obesity unrelated 368 157/211 13.71 (3.08) NURSERY HEALTH 18% Obese, control samples from T2D and Breast Cancer study unrelated 2726 0/2726 55.37 (6.88) US, Caucasian 24.89 25.96 (292) 26.11 (1208) 25.91 (1226) >0.05 ND [4] US POLLAND Cases from several disease groups unrelated 1827 840/987 56.54 (8.9) US Poland, Caucasian 35.01 (3.36) 34.97 (213) 34.78 (820) 35.23 (794) <0.05 ND [4] US POLLAND Control group unrelated 926 428/498 56.63 (9.42) US Poland, Caucasian 21.53 (0.85) 21.54 (80) 21.48 (411) 21.58 (435) <0.05 ND [4] unrelated 3996 1986/2010 49.30 (13.88) Germany, Caucasian 26.09 27.80 (434) 27.30 (1829) 27.01 (1733) 0.017 ND [4] families 694 338/356 31.65-52.03 Predominantly Caucasian , Boston area 26.1928.31 26.8729.97 (102) 24.58-27.69 (305) 24.6-27.04 (275) <0.05 ND [4] families 467 Male 38.72 (10.88) African American 31.83 (8.71) 31.06 (31) 33.07 (151) 32.87 (285) <0.05 ND [4] families 363 Female 38.02 (11.09) African American 27.76 (7.20) 27.47 (9) 27.37 (132) 28.40 (222) <0.05 ND [4] 41.99 (12.03) 43.97 (10.06) African American African American Germany, Caucasian Germany, Caucasian European, Caucasian European, Caucasian 41.87 (6.54) 21.28 (1.79) 38.90 (15) 20.71 (6) 42.95 (73) 20.89 (60) 43.44 (91) 21.07 (111) <0.05 ND [4] <0.05 ND [4] >27 27.38 27.16 27.18 0.65 ND [16] >27 30.35 29.72 29.53 0.007 ND [16] 26 (3.7) 27.2 (4.8) 25.9 (493) 27.0 (180) 25.8 (2157) 27.3 (710) 26.1 (2261) 27.3 (793) 0.06 ND [14] 0.61 ND [14] KORA S4 FHS (exam 1 to exam 5) MAYWOOD MAYWOOD WHO MONICA (cardiovascular disease project) Not selected for a particular trait Regardless of obesity phenotype Regardless of obesity phenotype MAYWOOD Obese- cases unrelated 179 ND MAYWOOD Lean- control group unrelated 177 ND SHIP (61% Obese) unrelated 4304 ND 20-79 SHIP-subgroup Overweight unrelated 2701 ND ND Epic5000 Cancer unrelated 4911 2172/2739 ND MRC ELY 22% obese unrelated 1683 772/911 ND Additional Table 2-contined. Summary Table of Results for the INSIG2 variant in the literature up to March 01 2008 Cohort DESIR DESIR Disease Sample or exam N (genotyped) Insulin resistance nonrandom selection Insulin resistance nonrandom selection unrelated 4998 ND Obesity ND Obesity ND Obesity MALE/ FEMALE Female Male 386 families(1765 subjects) +350 obese, 230 nonobese unrelated 449 families (2426 subjects) + 145 severe obese unrelated Female AGE Mean (SD) middleaged middleaged adult 966 ETHNICITY French, Caucasian French, Caucasian French, Caucasian BMI Mean (SD) Mean BMI C/C(N) Mean BMI G/C(N) Mean BMI G/G(N) Given p value ND 23.87 24 24.09 >0.05 ND [9] ND 25.35 25.54 25.43 >0.05 ND [9] ND 38.05 37.38 39.31 >0.05 ND French, Caucasian ND 34.26 35.44 34.46 >0.05 ND [9] Female child French, Caucasian ND 2.45 2.6 2.49 >0.05 ND [9] Male only child French, Caucasian ND 2.67 2.21 2.4 >0.05 ND [9] 25.62 (113) 26.2 (284) 29.3 (85) 35.7 (106) 26.7 (95) 26.6 (205) 25.94 (570) 26.3 (1135) 29.4 (329) 36.5 (455) 27.6 (360) 26.4 (770) 26.13 (689) 26.2 (1302) 26.7 (333) 35.9 (465) 26.8 (363) 26.6 (721) >0.05 ND [10] 0.39 ND [17] 0.97 ND [17] >0.05 ND [8] >0.05 ND [8] >0.05 ND [8] 233 962 1038 0.3 ND [31] 21 125 147 0.007 ND [15] 3542 HTO Hypertension 248 families 1425 ND 18.7-90.7 UK, Caucasian 25.4 NPHSII Control group unrelated 2721 Male 56.1 UK,Caucasian ND UDACS T2D and CAD under therapy unrelated 742 ND ND UK, AfroCaribbean-Indian ND unrelated 1040 [9] adult Obesity Obesity Ref. Male ND UTAH Obesity Assoc. Test* p 191/835 UTAH Control group unrelated 840 396/422 SAPHIR Atherosclerosis prevention in sample has high risk unrelated 1770 1107/626 Japanese cohort Randomly selected unrelated 2233 1128/1105 44.4 (11.4) 52.8 (8.5) 51.8 (8.5) Utah, Caucasian Austria, Caucasian 46 (7.6) 27.6 (4.9) 26.8 (4.1) 40-79 Japan 22.8 Utah, Caucasian German cohort Obese-Cases-1yr intervention unrelated 293 132/161 10.8 Caucasian 28.1 (*) Obesity association test: BMI>30 kg/m2 vs. BMI<30 of the C/C genotype at rs7566605 were compared and p values reported, please see ref 30 for details.
