Additional file Figure A1 Portable inclinometer with sensor attached
advertisement
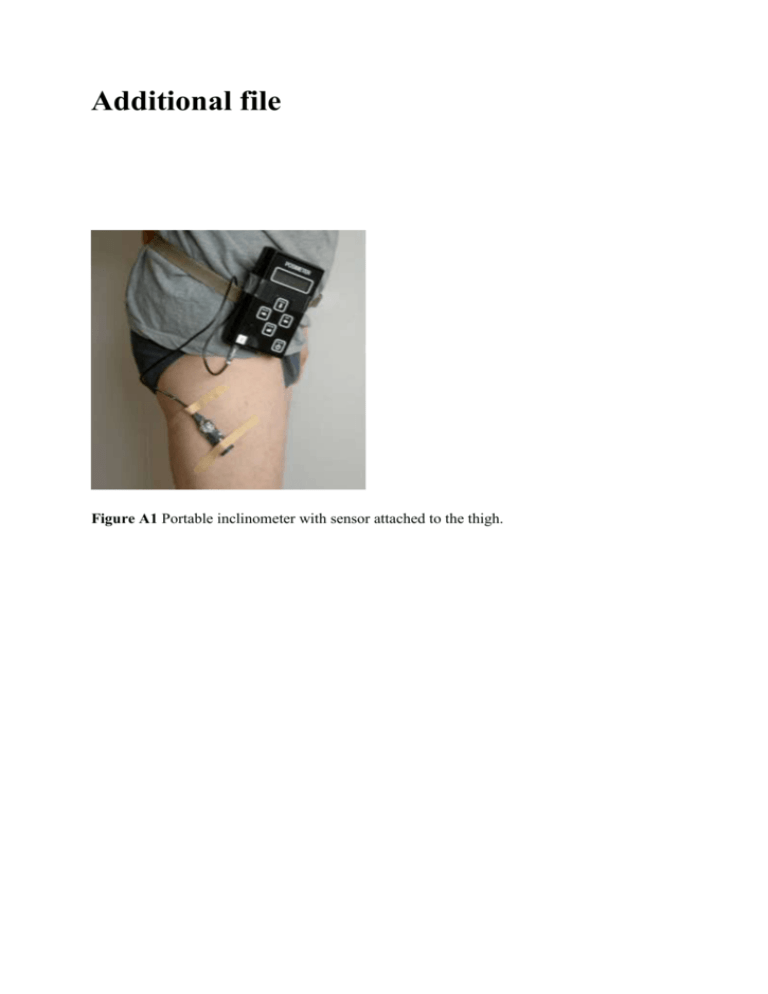
Additional file Figure A1 Portable inclinometer with sensor attached to the thigh. Standing/ walking 3 5 15 15 Seated 0 70 30 60 2 30 90 120 18 22 150 180 Time (min) Variable LEV1 FREQ1 FREQ2 FREQ3 FREQ4 FREQ5 SIM1 SIM2 SIM3 CRIT1 CRIT2 CRIT3 CRIT4 CRIT5 CRIT6 CRIT7 CRIT8 Value 76.1 % 2.7 h-1 34.3 min 8.6 min 38.9 % 0.0 % 0.72 0.86 0.37 51.7 min 52.3 min 80.0 min 83.5 min 11.1 % 13.3 % 32.2 % 37.2 % Comment Eight shifts in three hours Four seated periods 5 standing/walking periods One period seated longer than one hour (70 minutes) No periods standing/walking longer than one hour Four sets of seated and following standing/walking periods Three sequences: minutes 4-23, 24-98, 109-165 Three sequences: minutes 4-23, 24-98, 109-167 Two sequences: minutes 4-98, 109-170 Two sequences: minutes 4-103, 109-172 One sequence: minutes 79-98 Two sequences: minutes 79-98, 164-166 Two sequences: minutes 56-103, 160-169 Two sequences: minutes 51-103, 159-172 Figure A2 Illustration of the calculations of variables used in the present study (cf. Table 1). An imaginary recording sequence lasting 180 minutes comprised of seated and standing/walking periods is shown. The corresponding values of the variables in table 1 are given below the figure. A B C Figure A3 Examples of recordings from three call centre operators (A-C) showing different patterns of switches between seated (0) and standing/walking (1) postures. The x-axis shows duration of recording from start (hours: minutes). Figure A4 Seated periods of 3-100 seconds duration in proportion (%) of the total duration all 4218 recorded seated periods, stratified by period length, amongst call centre operators observed during whole work-shifts. Detail of Figure 3 in main file. Figure A5 Standing/walking periods of 3-100 seconds duration in proportion (%) of the total duration all 4357 recorded standing/walking periods, stratified by period length, amongst call centre operators observed during whole work-shifts. Detail of Figure 4 in main file. Table A1 Self-reported age, seniority at present company, height, weight and calculated body mass index (BMI) for the CC operators studied at the 16 call centres; in total and amongst male and female call centre operators. All 140 Number Age (years) Mean 34.4 Median 33.0 sd 10.6 Range 18-62 Seniority at company (years) Mean 3.54 Median 2.08 sd 4.36 Range 0.17-25.8 Height (m) Mean 1.71 Median 1.70 sd 0.085 Range 1.53-1.96 Weight (kg) Mean 71.4 Median 70.0 sd 13.5 Range 47-111 BMI (kg/m2) Mean 24.4 Median 24.0 sd 3.77 Range 16.2-37.7 1 Difference malesfemales Difference p-value1 Males 43 Females 97 31.0 29.0 8.8 20-53 35.9 35.0 11.1 18-62 -4.9 -6.0 0.011 2.78 1.83 2.49 0.17-9.08 3.84 2.13 4.90 0.17-25.8 -1.06 -0.30 0.599* 1.79 1.80 0.081 1.55-1.96 1.67 1.68 0.058 1.53-1.81 0.12 0.12 <0.001 81.5 82.0 10.5 60-111 67.3 65.0 12.3 47-107 14.2 17.0 <0.001 25.5 25.2 2.86 20.1-30.5 24.0 23.4 4.01 16.2-37.7 1.6 1.8 0.016 Two-tailed t-tests or Mann-Whitney test (*) if significant deviation from normal distribution. Boldface p-values indicate a significant difference (p<0.05).
