Word document
advertisement

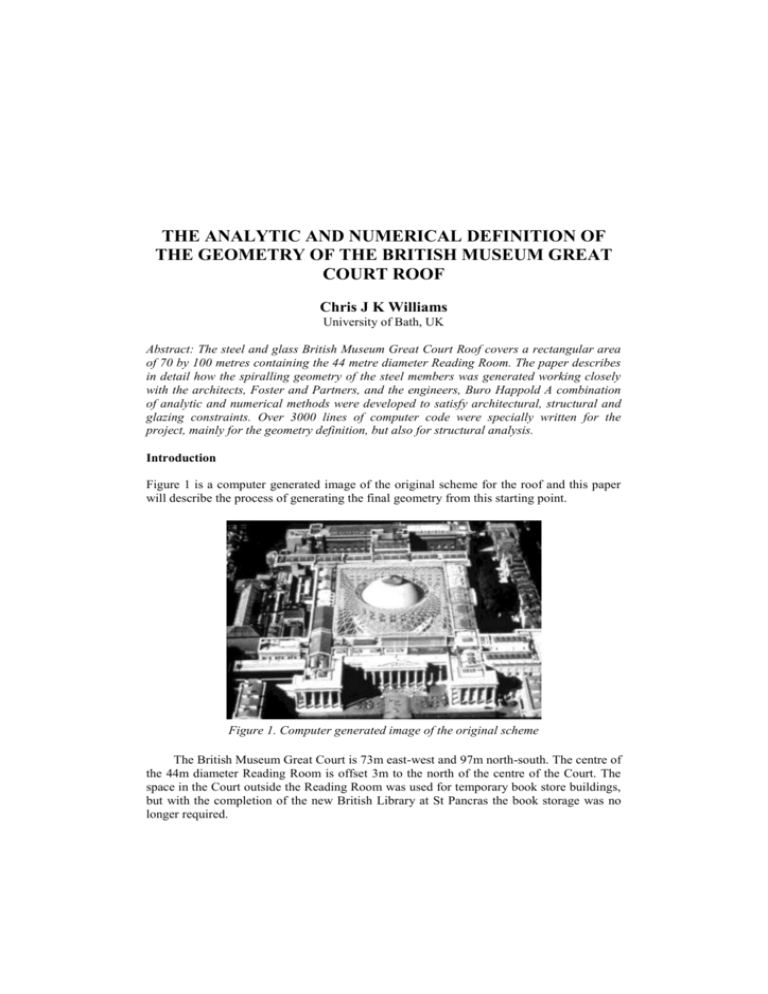
THE ANALYTIC AND NUMERICAL DEFINITION OF THE GEOMETRY OF THE BRITISH MUSEUM GREAT COURT ROOF Chris J K Williams University of Bath, UK Abstract: The steel and glass British Museum Great Court Roof covers a rectangular area of 70 by 100 metres containing the 44 metre diameter Reading Room. The paper describes in detail how the spiralling geometry of the steel members was generated working closely with the architects, Foster and Partners, and the engineers, Buro Happold A combination of analytic and numerical methods were developed to satisfy architectural, structural and glazing constraints. Over 3000 lines of computer code were specially written for the project, mainly for the geometry definition, but also for structural analysis. Introduction Figure 1 is a computer generated image of the original scheme for the roof and this paper will describe the process of generating the final geometry from this starting point. Figure 1. Computer generated image of the original scheme The British Museum Great Court is 73m east-west and 97m north-south. The centre of the 44m diameter Reading Room is offset 3m to the north of the centre of the Court. The space in the Court outside the Reading Room was used for temporary book store buildings, but with the completion of the new British Library at St Pancras the book storage was no longer required. The new roof over the Court was designed by Foster and Partners, architects, and Buro Happold, engineers, and was fabricated and erected by Waagner Biro. The roof is constructed of a triangular grid of steel members welded to node pieces. The members are boxes welded from plate and are tapered to change depth. The grid is triangulated for structural stiffness and so that it can be glazed with one flat panel of double glazing for each triangle of the structural grid. The roof is supported around the Reading Room and on the rectangular boundary where it sits on sliding bearings to avoid imposing lateral thrusts on the existing building. This means that the roof can only push outwards at the corners where it can be resisted by a tension in the edge beam. Internal tension ties were considered, but rejected on architectural grounds. The surface geometry The shape of the roof is defined by a surface on which the nodes of the steel grid lie. The height of the surface, z, is a function of x in the easterly direction and y in the northerly direction. The origin lies on a vertical line through the centre of the Reading Room. The function is: z z1 z 2 z3 where z1 hcentre hedge hedge , 35.0 10.0 z2 1 7.5 12.0 1 12 1 cos2 24.0 1 cos 2 sin 2 2 1 1 cos2 sin 1.6 2 2 1 1 10.0 1 cos2 10.0 1 cos2 sin 1.0 3.0 2 2 2 2 2 1 1 r 2.5 1 cos2 sin 1 a 2 2 and z3 3.5 3.0 1 cos2 1 cos 2 0.3s in 2 2 x y y 1 x 1 b 1 c 1 d b . 1.05e e e e x r y r In these expressions the polar co-ordinates, r x 2 y 2 and cos1 sin1 , and x x 1 1 1 b b ax ax 1 1 1 rb rb a 2 1 b x c y r b x c y y y 1 x x r y y c d , 1 1 1 1 , 1 and b b c d a ay ay 1 rc rd 2 b x2 d y2 b x2 c y2 b x2 d y2 . b xd y b xc y b xd y The constants are a 22.245 , hcentre 20.955 and hedge 19.71 . b 36.625 , c 46.025 , 2 d 51.125 , 0.5 , 14.0 , The functions z1 , z2 and z3 are each built up from its own fundamental function. The first, shown in figure 2, supplies the correct change in level between the rectangular boundary and the circular Reading Room. The vertical scale in the figure is chosen arbitrarily. The original scheme had the roof level arching up along each of the rectangle edges, and this would have had certain structural advantages, but the final scheme has a constant height along the edges. The remaining two fundamental functions give z 0 around the rectangular and circular boundaries. Figure 2. Level change function, x x 1 1 1 b b ax ax 1 1 1 rb rb Figure 3. Function with finite curvature at corners y y 1 c d ay ay 1 rc rd r 11 a x x 1 1 b b y y 1 c d Figure 4. Function with conical corners 1 b x c y b x c y 2 2 b x d y b x d y 2 2 a r b x c y b x c y 2 Figure 5. Final surface 3 2 b x d y b x d y 2 2 The second fundamental function is shown in figure 3. Both this function and the first produce a horizontal surface at the corners. This is inevitable unless the curvature tends to infinity at the corners, like approaching the tip of a cone and this is what happens with the third fundamental function shown in figure 4. The issue of the curvature of the corners was important for architectural and structural reasons and the relative amount of the second and third fundamental functions was chosen to balance these constraints. The corners were important structurally because of the thrusts coming down to the corners to be balanced by tensions in the edge beam. The corners are reinforced locally by external trusses which cannot be seen from inside the Court. The final shape was obtained by adding a constant times the first fundamental function to the second and third fundamental functions multiplied by two different functions of x and y. These extra functions were chosen to satisfy planning, architectural and structural constraints. Figure 5 shows the final surface on which the faceting is that of the glazing grid. The concentration of curvature at the corners can be seen. The structural grid The structural grid passed through many stages before arriving at the final form as shown in the right hand drawing in figure 6. In the early scheme on the left of figure 6 the grid meets the rectangular boundary in an unsatisfactory way in that some triangles are cut through, leading to a combination of triangles and quadrilaterals. The central drawing overcomes this problem, but is still coarse compared to the final form. The starting point in producing the final grid is shown in figure 7. This is a simple geometric drawing in which points equally spaced around the Reading Room are joined to equally spaced points around the rectangular boundary. The radial lines so formed are then divided into varying numbers of equal segments. The structural grid is produced from this ‘mathematical grid’ by ‘joining the dots’ as seen in the right hand half of figure 7. Figure 6. Evolution of the structural grid However this produces discontinuities, particularly on the diagonal directions. These were removed by ‘relaxing’ the grid to produce figure 8. The relaxation process was as follows. 4 Figure 7. Starting grid Figure 9 shows a typical node, i, j of the mathematical grid surrounded by its four neighbours. If pi, j is the position vector of the typical node at some point during the relaxation process, then f i, j pi1, j pi, j pi1, j pi, j 2 pi, j1 pi, j pi, j1 pi, j would be the fictitious force applied to the node by ‘strings’ attached to the neighbouring nodes if the tension coefficients of the strings are 1, 1, 2 and . The tension coefficient is the tension in a member divided by its length. The purpose of the variable will be described later. Now imagine that the nodes of the mathematical grid are free to slide with no friction over the surface defining the shape. The force qi, j fi, j f i, j ni, j ni, j (where n i, j is the unit normal to the surface) is the component of f i, j tangential to the surface and therefore the nodes will slide until all the q i, j 0 . The quantity 1 0.0041.5m j 1 cos2 where m 70 is the value of j on the Reading Room boundary and is the polar co-ordinate. This function was chosen so as to 5 control the maximum size of the glass triangles which occur near the centre of the southern boundary. It was the limitation on glass size which was the controlling factor in choosing the structural grid. Figure 8. Relaxed grid i1, j i, j1 i, j i, j1 i1, j Figure 9. Typical grid nodes Figure 10. Elevation of structural grid looking north The non-linear equations q i, j 0 were solved by repeated application of the algorithm pi, j th is cycle c1qi, j c2 pi, j th e previous cyclewhere pi, j is the movement of the typical node and the constants c1 and c2 1.0 are chosen to optimise the speed of convergence. The larger the constants, the faster the convergence, but if they are too high, 6 numerical instability occurs. This process is known as dynamic relaxation and was invented by Alister Day. The whole mathematical grid was run through 5000 cycles before the process was judged to have converged. Convergence was speeded by using setting c2 0 when the sum of the squares of the pi, j passed through a maximum. Figures 10, 11 and 12 show the final structural grid. Figure 11. Elevation of structural grid looking west Figure 12. Isometric of structural grid Figure 13. Outwards deflections due to loading 7 Figure 14. View showing south side collapsed while north remains standing Structural analysis A detailed description of the structural analysis of the roof is beyond the scope of this paper. A specially written computer program was used, together with commercial software. Figures 13 and 14 show the deflections due to a large vertical load, much larger than possible on the roof. The spreading of the boundaries can be seen on the plan and on figure 14 it can be seen that the south side has collapsed, hanging in tension, while the north side still stands. Figure 15. Day and night views Conclusion This paper discusses one aspect of one project and figure 15 contains photographs of the completed Great Court. Papers by the architects, engineers and builders of this and other recent projects are contained in Barnes and Dickson (2000). References Michael R. Barnes and Michael G.T. Dickson, Thomas Telford, Widespan roof structures, London 2000 8


