speed versus time - Bryan Middle School
advertisement
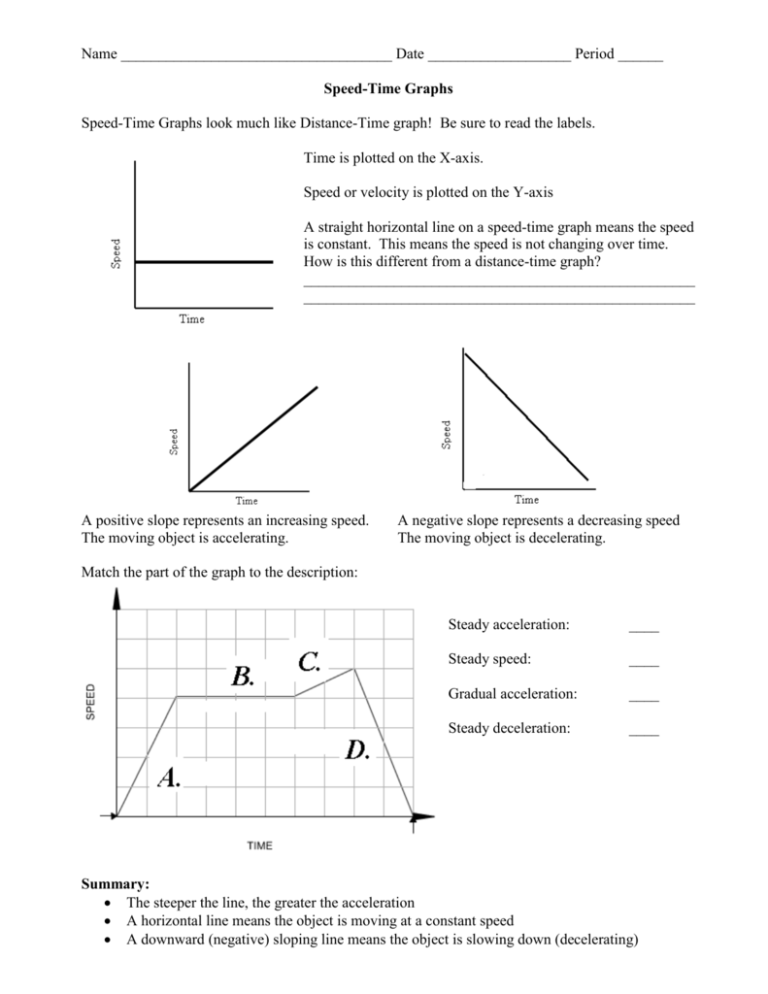
Name ____________________________________ Date ___________________ Period ______ Speed-Time Graphs Speed-Time Graphs look much like Distance-Time graph! Be sure to read the labels. Time is plotted on the X-axis. Speed or velocity is plotted on the Y-axis A straight horizontal line on a speed-time graph means the speed is constant. This means the speed is not changing over time. How is this different from a distance-time graph? ____________________________________________________ ____________________________________________________ A positive slope represents an increasing speed. The moving object is accelerating. A negative slope represents a decreasing speed The moving object is decelerating. Match the part of the graph to the description: Steady acceleration: ____ Steady speed: ____ Gradual acceleration: ____ Steady deceleration: ____ Summary: The steeper the line, the greater the acceleration A horizontal line means the object is moving at a constant speed A downward (negative) sloping line means the object is slowing down (decelerating) Acceleration If the statement is true, write true. If it false, change the underlined word or words to make the statement true. _____________________________ 1. If a train is slowing down, it is accelerating. _____________________________ 2. To find the acceleration, you must calculate the change in distance during each unit of time. _____________________________ 3. A Ferris wheel is turning at a constant speed of 5 m/s is not accelerating. _____________________________ 4. An airplane is flying west at 200 km/h. 2 hours later, it is flying west at 300 km/h. Its average acceleration is 100 km/h2. _____________________________ 5. Graph A plots a race car’s speed for 5 seconds. The car’s rate of acceleration is 6 m/s2. _____________________________ 6. Graph B plots the same car’s speed for a different 5 second interval. The car’s acceleration during this interval is 12 m/s2. Match each of the following: A. the car is traveling at a constant speed 1. 2. B. The car is accelerating C. the car is decelerating 3. Graph 1 matches description ______ because ____________________________________________ Graph 2 matches description ______ because ____________________________________________ Graph 3 matches description ______ because ____________________________________________ Key: Distance time graph a horizontal line represents an object that is not moving (stopped) A B C D 1. True 2. False. speed (and/or velocity) 3. False. Is 4. False. 50 km/hr/hr 5. True 6. False. 0 m/s/s Graph 1: B. positive slope Graph 2: C. negative slope Graph 3: A. speed not changing/zero slope
