Supplementary table 10: Focal regions of amplification
advertisement
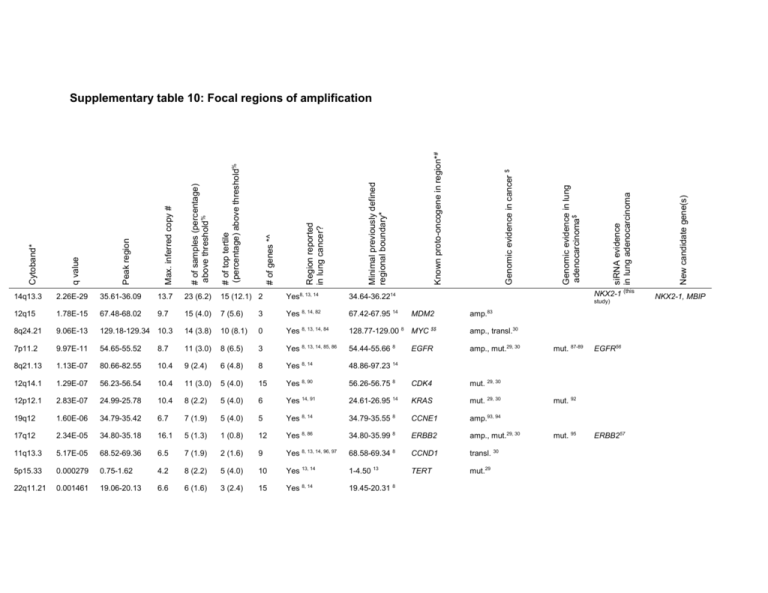
12q15 1.78E-15 67.48-68.02 8q24.21 9.06E-13 7p11.2 9.7 15 (12.1) 2 Yes8, 13, 14 8, 14, 82 NKX2-1 (this 34.64-36.2214 67.42-67.95 14 study) MDM2 amp. 83 15 (4.0) 7 (5.6) 3 Yes 129.18-129.34 10.3 14 (3.8) 10 (8.1) 0 Yes 8, 13, 14, 84 128.77-129.00 8 MYC $$ amp., transl.30 9.97E-11 54.65-55.52 8.7 11 (3.0) 8 (6.5) 3 Yes 8, 13, 14, 85, 86 54.44-55.66 8 EGFR amp., mut.29, 30 8q21.13 1.13E-07 80.66-82.55 10.4 9 (2.4) 6 (4.8) 8 Yes 8, 14 48.86-97.23 14 12q14.1 1.29E-07 56.23-56.54 10.4 11 (3.0) 5 (4.0) 15 Yes 8, 90 56.26-56.75 8 CDK4 mut. 29, 30 12p12.1 2.83E-07 24.99-25.78 10.4 8 (2.2) 5 (4.0) 6 Yes 14, 91 24.61-26.95 14 KRAS mut. 29, 30 19q12 1.60E-06 34.79-35.42 6.7 7 (1.9) 5 (4.0) 5 Yes 8, 14 34.79-35.55 8 CCNE1 amp.93, 94 17q12 2.34E-05 34.80-35.18 16.1 5 (1.3) 1 (0.8) 12 Yes 8, 86 34.80-35.99 8 ERBB2 amp., mut.29, 30 11q13.3 5.17E-05 68.52-69.36 6.5 7 (1.9) 2 (1.6) 9 Yes 8, 13, 14, 96, 97 68.58-69.34 8 CCND1 transl. 30 5p15.33 0.000279 0.75-1.62 4.2 8 (2.2) 5 (4.0) 10 Yes 13, 14 1-4.50 13 TERT mut.29 22q11.21 0.001461 19.06-20.13 6.6 6 (1.6) 3 (2.4) 15 Yes 8, 14 19.45-20.31 8 mut. 87-89 EGFR56 mut. 92 mut. 95 ERBB257 New candidate gene(s) siRNA evidence in lung adenocarcinoma Genomic evidence in lung adenocarcinoma$ Genomic evidence in cancer $ Known proto-oncogene in region*# Minimal previously defined regional boundary* Region reported in lung cancer? 23 (6.2) # of genes *^ 13.7 # of top tertile (percentage) above threshold% Peak region 35.61-36.09 # of samples (percentage) above threshold% 2.26E-29 Max. inferred copy # 14q13.3 q value Cytoband* Supplementary table 10: Focal regions of amplification NKX2-1, MBIP 5p15.31 0.007472 8.88-10.51 5.6 5 (1.3) 4 (3.2) 7 Yes 8 8.88-14.31 8 1q21.2 0.028766 143.48-149.41 4.6 5 (1.3) 4 (3.2) 86 No 20q13.32 0.0445 55.52-56.30 4.4 5 (1.3) 4 (3.2) 6 No 5p14.3 0.064673 19.72-23.09 3.8 5 (1.3) 3 (2.4) 2 No 6p21.1 0.078061 43.76-44.12 7.7 4 (1.1) 3 (2.4) 2 No 6p21.33 0.10468 30.24-30.53 6.2 3 (0.8) 3 (2.4) 5 No 2p15 0.12296 61.87-63.04 13.1 2 (0.5) 2 (1.6) 5 Yes 14 49.10-64.73 14 7q21.2 0.12296 91.38-92.69 7.7 3 (0.8) 3 (2.4) 11 Yes 8 90.81-92.22 8 3q26.2 0.12892 171.56-172.26 5.8 3 (0.8) 2 (1.6) 5 No 19q13.12 0.135 40.27-40.43 7.7 3 (0.8) 1 (0.8) 5 No 18q11.2 0.135 21.54-21.90 6.3 3 (0.8) 2 (1.6) 1 No 8p11.23 0.14247 38.16-40.88 8.1 4 (1.1) 4 (3.2) 16 Yes 8, 14 ARNT transl., mut. 29, 30 VEGFA 38.24-38.45 14 CDK6 mut., transl., amp. 29, 30 SKIL mut. 29 SS18 transl. 30 FGFR1 mut, transl. 29, 30 WHSC1L1 14 * based on hg17 human genome assembly, positions in Mb; # Known proto-oncogenes defined as found in either COSMIC 29, CGP Census 30 or other evidence; if there is more than one known proto-oncogene in the region, only one is listed (priority for listing is, in order: known lung adenocarcinoma mutation, known lung cancer mutation, other known mutation (by COSMIC frequency), listing in CGP Census); % Most variable numbers and percentages refer to the top 1/3 least stromally contaminated samples, as assayed by standard deviation measurements; ^ RefSeq genes only; $ Abbreviations are amp. = amplification, transl. = translocation and mut. = mutation; $$ MYC is near, but not within the peak region.
