Tables & Charts
advertisement
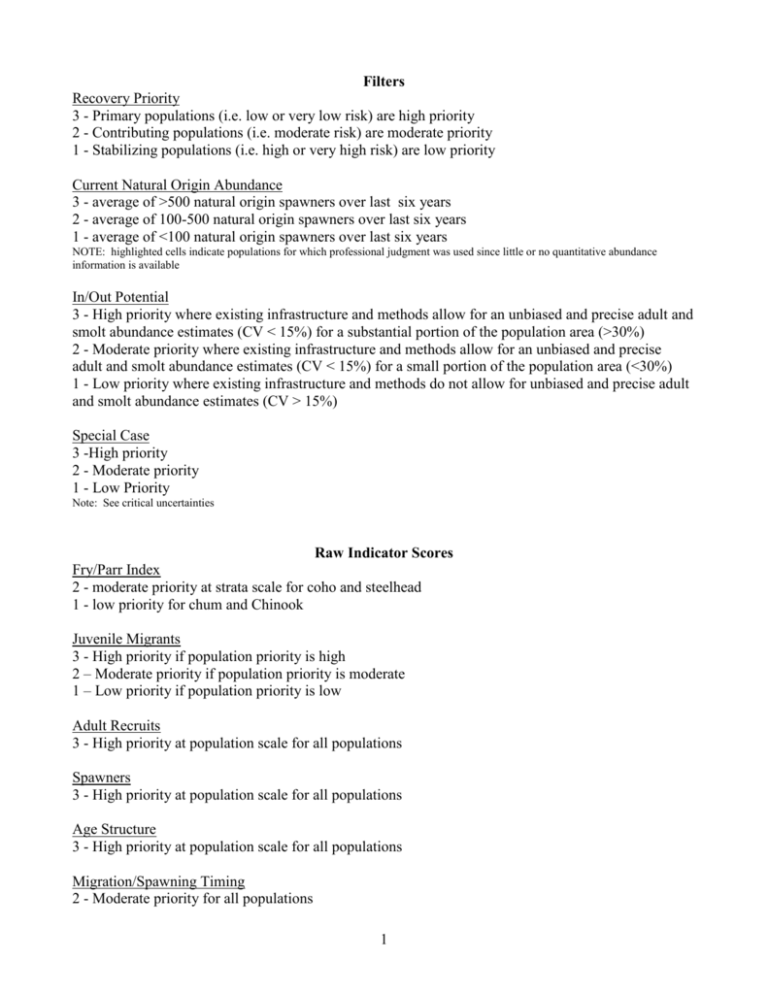
Filters Recovery Priority 3 - Primary populations (i.e. low or very low risk) are high priority 2 - Contributing populations (i.e. moderate risk) are moderate priority 1 - Stabilizing populations (i.e. high or very high risk) are low priority Current Natural Origin Abundance 3 - average of >500 natural origin spawners over last six years 2 - average of 100-500 natural origin spawners over last six years 1 - average of <100 natural origin spawners over last six years NOTE: highlighted cells indicate populations for which professional judgment was used since little or no quantitative abundance information is available In/Out Potential 3 - High priority where existing infrastructure and methods allow for an unbiased and precise adult and smolt abundance estimates (CV < 15%) for a substantial portion of the population area (>30%) 2 - Moderate priority where existing infrastructure and methods allow for an unbiased and precise adult and smolt abundance estimates (CV < 15%) for a small portion of the population area (<30%) 1 - Low priority where existing infrastructure and methods do not allow for unbiased and precise adult and smolt abundance estimates (CV > 15%) Special Case 3 -High priority 2 - Moderate priority 1 - Low Priority Note: See critical uncertainties Raw Indicator Scores Fry/Parr Index 2 - moderate priority at strata scale for coho and steelhead 1 - low priority for chum and Chinook Juvenile Migrants 3 - High priority if population priority is high 2 – Moderate priority if population priority is moderate 1 – Low priority if population priority is low Adult Recruits 3 - High priority at population scale for all populations Spawners 3 - High priority at population scale for all populations Age Structure 3 - High priority at population scale for all populations Migration/Spawning Timing 2 - Moderate priority for all populations 1 Sex 3 - High priority at population scale for all populations Origin 3 - High priority at population scale for all populations Fry/Parr Spatial Structure 2 - Moderate priority for strata scale Spawner Spatial Structure 3 - High priority at population scale for all populations Calculations Relative Priority Score (RPS) = (Raw Indicator Score) x (Recovery Priority Score) x (Current Abundance Score) x (Fish In/Fish Out Score x Special Cases Score) Total Species Population Score = ∑Relative Indicator Scores for a Species & Population Total Adult Species Population Score = Recovery Priority x Current Abundance x Special Needs x Spawner Distribution Priority for All Species by Population Area Total Juvenile Species Population Score = Juvenile Migrant Priority x In/Out Trapping Potential x Special Needs Total Population Area Score = ∑Total Species Population Scores Total Adult Population Area Score = ∑Total Adult Species Population Scores Total Juvenile Species Population Score = ∑Total Juvenile Species Population Scores 2 All Species - Adults and Juveniles Population Youngs Bay Big Creek Clatskanie Scappoose Grays/Chinook Eloch./Skam. Mill/Aber./Ger. Sandy Clackamas Lower Cowlitz Coweeman SF Toutle NF Toutle Upper Cowlitz Cispus Tilton Kalama NF Lewis EF Lewis Salmon Washougal Lower Gorge Upper Gorge White Salmon Hood Fall 46 46 150 75 288 450 1350 96 48 144 1350 Chinook Late Fall 225 Sum. 48 69 432 23 675 48 48 150 432 450 675 Fall 23 23 225 225 2025 150 450 75 48 48 675 675 Chum Spr. 1350 675 675 69 144 675 48 75 23 75 1350 48 225 48 Steelhead Win. Sum. 486 729 729 486 243 312 1458 486 729 52 729 243 729 972 972 150 729 1458 312 75 162 486 25 104 729 162 50 2187 486 324 Coho 50 150 729 486 81 486 936 486 729 486 729 162 729 1458 1458 225 52 468 162 25 104 324 81 324 Total Score 605 948 1833 1272 2637 1398 4194 1818 2229 730 2856 1176 2229 3174 3174 513 2863 3630 1560 96 1687 1884 2414 327 1791 Total Score for All Species - Adults and Juveniles 4500 4000 3500 3000 2500 2000 1500 1000 500 M ill/ A be r./ G U NF e r pp L . e er w C is ow C li tz is p Ka us C la G ow ma ra ee ys m / a U Chi n pp n er oo G k N org F C To e la u Lo cka tl e we m r as C Gor la t s ge ka ni Sa e nd W H y as oo ho d EF ug a El oc Le l w h. is Sc /Ska ap m p . SF oos T e Bi ou Lo g tl e we Cr r ee Yo Cow k un li t gs z Ba W hi T y te i lt Sa on lm Sa on lm on 0 3 All Species - Adults Population Youngs Bay Big Creek Clatskanie Scappoose Grays/Chinook Eloch./Skam. Mill/Aber./Ger. Sandy Clackamas Lower Cowlitz Coweeman SF Toutle NF Toutle Upper Cowlitz Cispus Tilton Kalama NF Lewis EF Lewis Salmon Washougal Lower Gorge Upper Gorge White Salmon Hood Fall 3 3 9 9 12 18 54 6 6 18 54 Chinook Late Fall 27 27 18 3 27 6 6 9 18 27 27 6 3 27 Chum Spr. 81 27 27 3 6 27 Fall 3 3 27 27 81 9 27 9 6 Sum. 6 6 9 3 9 81 6 9 6 Steelhead Win. Sum. 27 27 27 27 27 12 54 27 27 6 27 27 27 36 36 6 27 54 12 3 18 18 3 12 27 18 3 81 18 Coho 3 6 27 27 9 18 36 27 27 27 27 18 27 54 54 9 6 18 18 3 12 18 9 18 18 Total Score 36 39 90 90 129 57 171 123 93 57 108 78 54 120 117 18 117 177 54 12 87 123 105 15 81 Total Score for All Species - Adults (Recovery Priority x Current Abundance x Special Needs x Spawner Distribution Priority) M N F ill/ Le A G be wis ra ys r./ G /C e hi r. no o Lo S k we an d U pp r G y o er rg C e ow l C i tz is pu s K C al a ow m U ee a pp m er an C Go la ck rge C am la as t Sc ska ap ni e W poo a s se ho ug a H l SF oo d El oc T ou h t Lo . /S l e we ka rC m o . N wli F t To z EF utl L e Bi ew is g Yo Cr un ee gs k Ba W y hi Ti te lto Sa n lm Sa on lm on 200 180 160 140 120 100 80 60 40 20 0 4 All Species - Juveniles Population Youngs Bay Big Creek Clatskanie Scappoose Grays/Chinook Eloch./Skam. Mill/Aber./Ger. Sandy Clackamas Lower Cowlitz Coweeman SF Toutle NF Toutle Upper Cowlitz Cispus Tilton Kalama NF Lewis EF Lewis Salmon Washougal Lower Gorge Upper Gorge White Salmon Hood Fall 2 2 6 3 6 9 27 4 2 2 18 Chinook Late Fall 3 9 6 1 9 2 2 6 6 6 9 2 3 9 Chum Spr. 9 27 27 3 6 27 Fall 1 1 9 9 27 6 18 3 2 Sum. 2 2 3 1 3 18 2 9 2 Steelhead Win. Sum. 6 9 9 6 3 6 27 6 9 2 9 3 9 18 18 3 9 18 6 3 3 9 1 2 9 3 2 27 9 6 Coho 2 3 9 6 3 9 18 6 9 6 9 3 9 18 18 3 2 6 3 1 2 6 3 6 Total Score 11 15 33 24 39 30 90 28 31 12 36 17 18 66 63 9 43 63 15 4 25 29 36 8 36 Total Score for All Species - Juveniles (Juvenile Migrant Priority x In/Out Trapping Potential x Special Needs) U M ill/ Ab pp er. er /G C er. ow l C i tz is N pu F s Le w G ra Kal is ys am /C a C hi n ow oo U ee k pp m er an G or ge H C o la t od C ska la n El cka i e oc m h a Lo . /S s we kam rG . or ge S W a n as d h y Sc o u ap ga po l N os F e T SF out T le Bi out g l C e r e E Lo F ek we Le r wis Yo Cow un li t gs z Ba W y hi Ti te lto Sa n lm Sa on lm on 100 90 80 70 60 50 40 30 20 10 0 5 Yo un Bi gs C g C Ba Sc lat s ree y ap ka k po ni e El o o c Gr s e ho ay m s C la M- an ck A am -G Sa a s C nd o Ka wli y l a tz m Le a W Sa wi Lo ash l mo s we ou n U pp r G gal or er G ge or ge Low High Low Moderate Chu I nd ic 2 High SP mV ng t or i oni M r at o e ati v R el m Chu 2 1 0 Special Case In/Out Potential Current Natural Origin Abundance Recovery Priority 6 Moderate Yo un Bi gs g B C C ay Sc lat s ree ap ka k po ni e os El G e oc r ho ay m s an C la Mck A a m -G Sa as n C ow dy Ka li t z la m a Le wi S W al s Lo ash mo ou n we g U pp r Go al er r G ge or ge Chum s ri tie Pr io 3 1 0 Fry/Parr Index & Distribution Migration/ Spawn Timing Juvenile Migrants Spawner & adult recruit abundance; adult age, sex, origin, and distribution rs Filte 3 G ra ys or ge G 7 Sa lm on Le wi s W as ho ug al C la ck am as C ow li t z Ka la m U a pp er G or ge Yo un gs Ba y Bi g C re ek Sa nd y M -A -G El oc ho m an la ts ka ni e Sc ap po os e C Lo we r -A ow li t z U Ka la m a pp er G or ge Yo un gs Ba y Bi g C re ek Sa lm on C Le wi s Sa nd y W as ho ug al C la ck am as C -G la ts ka ni Sc e ap po os e El oc ho m an M G ra Lo ys we rG or ge Chum Total Score for Chum - Adults and Juveniles 2500 2000 1500 1000 500 0 Total Score for Chum - Adults 90 80 70 60 50 40 30 20 10 0 ra ys 8 Sa lm on Le wi s W as ho ug al C la ck am as C ow li t z Ka la m U a pp er G or ge Yo un gs Ba y Bi g C re ek Sa nd y M -A Lo -G we rG or ge C la ts ka ni e Sc ap po os e El oc ho m an G Chum Total Score for Chum - Juveniles 30 25 20 15 10 5 0 Yo Bi ung C Sc la g C s B ap t sk re ay El a e oc G poo ni e k ho ra se C la m y ck s a M an C L C Sa ma ill To owe ow ndy s T u m l itz U out tle an C le SF C ow NF is li t p z U Le Ka Ti lt us pp l o a w L er ew i s ma n H G oo L W S i s N or d o a a E F ge /U w sh l m F (W pp er G oug on as er G or al g hi ng org e to e n) High High nd PI ic o nit Mo ho Co Fil t iv 2 9 1 0 Special Cases In/Out Potential Recovery Priority Current Natural Origin Abundance Low Moderate h Co S oV r ato ela gR rin r rio eP 2 1 0 Low Moderate Yo B un Sc Cla ig Cgs B t a p sk re ay El oc G poo ani ek ho ra se e C la m ys ck a M an C L C Sa ma ill o n o s w T d T ou em wl i y U out tle an tz C le SF C ow NF is li t p U pp Le Ka Ti lt us z er Le wi l am on H s G o w a W or od Lo a Sa i s NF ge /U w sh l m EF (W pp er ou on as er Go gal hi Go rge ng rg to e n) Coho s itie 3 Fry/Parr Index & Distribution Migration/ Spawn Timing Juvenile Migrants Spawner & adult recruit abundance; adult age, sex, origin, and distribution s ter 3 ow li C tz is pu s C la Mil l ts Sc ka ap ni e C poo la ck se am as Sa L ndy Co C wl i ow tz e To ma u n El tle o c NF ho To ma ut n le Le S wi F s Le NF wi L H oo owe s E F d/ r U Go pp r er ge W Go as rg ho e U pp ug er al G G or r a ge y (W T s i as lto hi n n Bi gto n g C ) re K ek Yo al a un ma gs B Sa ay lm on C U C ow C li t z is pu s C la Mil l ts C ka la n ck i e a C ma ow s e To ma u n Sc tle ap NF El poo o c se ho m an Sa L ndy Co Le wl itz w H Low i s oo N e F d/ r U Go pp er rge G or ge Ti To lto ut n le Le S wi F s Bi EF g U pp W Cre as ek er ho G or ug ge a (W G l r as ay hi s ng to Ka n) Yo l a un ma gs B Sa ay lm on U Coho Total Score for Coho - Adults and Juveniles 1600 1400 1200 1000 800 600 400 200 0 Total Score for Coho - Adults 60 50 40 30 20 10 0 10 C M ill ow li C tz is p C la us ts El kan oc i h e C om la ck a n a C ma ow s em To an u Sc tle ap NF po os e Sa n L d Co y wl Le itz wi L s o H oo we NF d/ r U Go pp er rge G Bi org g C e re ek G r To ay ut s U le pp SF er G T or i ge Le lton (W wi s as EF h Yo ing un ton gs ) B Ka ay W l am as ho a ug Sa a l lm on U Coho Total Score for Coho - Juveniles 20 18 16 14 12 10 8 6 4 2 0 11 Yo un Bi gs C g C Ba Sc lat s re y ap ka ek po ni e El oc Gr ose ho ay m s C a la ck MA n am G L Sa as Co nd U C wl it y ow z C ow To li tz ee utl Ka ma e la n m L a W Sa ew Lo as l m i s we ho on u U pp r G ga or l er g G W or e hi te H ge Sa oo lm d on 3 High 2 1 Low Moderate 3 High lC F al k oo hin VS n PI r ato dic o nit Mo l F al P ve lat i Re g rin ino Ch ok r rio 2 1 Low Moderate Yo u B ng C ig C s B l Sc at r a ap sk ee y po an k El oc G os i e ho ray e C m s la ck M a n am AG S L a a U Co nd s C wl y ow itz C ow T li e ou tz Ka em tle l a an m W S Le a Lo as al m wi s h w o U e ou n pp r G g er o al W G rge hi or te g Sa Hoo e lm d on Fall Chinook s itie 0 Fry/Parr Index & Distribution Migration/ Spawn Timing Juvenile Migrants Spawner & adult recruit abundance; adult age, sex, origin, and distribution ers Filt 0 Special Cases In/Out Potential Current Natural Origin Abundnace Recovery Priority 12 ow M AG ee m an To ut le Le W wi as s ho u El oc gal ho m an L Co wl it Ka z W l am hi te a Sa lm on G ra C ys la ts k Sc an ap i e po os e H oo C la ck d am as S Lo a we nd rG y U pp org e er G Yo o un rge gs Bi Bay g C re ek U C ow li t Sa z lm on C ow M AG ee m an To ut le Le W wi as s ho ug El a oc ho l m an W Kal am hi te a Sa lm on G C ray la ts s ka ni e H oo L Co d wl itz Sa Sc n ap dy po os U e C ow C li la ck tz a Lo m a we rG s U pp org e er Yo Gor un ge gs Bi Bay g C re e Sa k lm on C Fall Chinook Total Score for Fall Chinook - Adults and Juveniles 1600 1400 1200 1000 800 600 400 200 0 Total Score for Fall Chinook - Adults 60 50 40 30 20 10 0 13 ow M AG ee m El oc an ho m an To ut le Le W wi as s ho ug C a la ts l ka ni e G ra y Ka s la m a W H hi te ood Sa lm on Sa n Sc ap dy po os U e C o w Yo un li tz gs Ba Bi y g C re C e la ck k am as L C Lo ow we l itz rG U pp org e er G or g Sa e lm on C Fall Chinook Total Score for Fall Chinook - Juveniles 30 25 20 15 10 5 0 14 Late Fall Chinook e L at k inoo VS 3 High Low Moderate Ch Fall in itor Mon r o t dica P In it ies ri or eP v i t el a gR Fry/Parr Index & Distribution 2 Migration/ Spawn Timing 1 Juvenile Migrants Spawner & adult recruit abundance; adult age, sex, origin, and distribution e Fa L at r Fi lte s High ll k noo C hi Low Moderate Sa nd y Le wi s 0 3 2 Special Cases In/Out Potential 1 Current Natural Origin Abundance Sa nd y Le wi s 0 Recovery Priority 15 Late Fall Chinook Total Score for Late Fall Chinook - Adults and Juveniles 1600 1400 1200 1000 800 600 400 200 0 Lewis Sandy Total Score for Late Fall Chinook - Adults 90 80 70 60 50 40 30 20 10 0 Lewis Sandy 16 Late Fall Chinook Total Score for Late Fall Chinook - Juveniles 10 9 8 7 6 5 4 3 2 1 0 Lewis Sandy 17 Spring Chinook Chi noo S 3 High kV e gR s it ie ri or 2 Moderate ing Spr n tori oni or M t a dic P In ve P l at i Low 1 0 Fry/Parr Index & Distribution C la ck am as Sa nd C y ow li t C z is pu s Migration/ Spawn Timing on Sa lm W hi te ing Spr Spawner & adult recruit abundance; adult age, sex, origin, and distribution k noo Chi ers Fi lt 3 High oo d H Ti lto n To u t Ka le la m a Le wi s Juvenile Migrants Moderate 2 Low 1 0 Special Cases C la ck am as Sa nd C y ow li t z C is pu s Ti lto n In/Out Potential oo d Recovery Priority W hi te Sa lm on H To ut le Ka la m a Le wi s Current Natural Origin Abundance 18 Spring Chinook Total Score for Spring Chinook - Adults and Juveniles 800 700 600 500 400 300 200 100 on Sa lm W hi te To ut le Ti lto n Ka la m a H oo d Sa nd y Le wi s is pu s C li t z ow C C la ck am as 0 Total Score for Spring Chinook - Adults 30 25 20 15 10 5 19 Ti lto n on Sa lm W hi te Ka la m a To ut le oo d H Le wi s is pu s C li t z ow C Sa nd y C la ck am as 0 Spring Chinook Total Score for Spring Chinook - Juveniles 30 25 20 15 10 5 on Sa lm W hi te To ut le Ti lto n Ka la m a Sa nd y oo d H la ck am as C Le wi s is pu s C C ow li t z 0 20 Yo B un C ig gs Sc la C B ap t sk ree ay a El oc G poo ni e k h C om ray se la ck an s a L S m Mi U Co an as ll C w d C ow l itz y is li t SF T pu z C NF T o i lto s ow T u n ee ou tl e N Ka ma tl e l F a EF L m n L ew a Lo Wa Sa ew is s w ho l mo is U e pp r u er Go ga n G rg l or e H ge oo d High ter Win High e 2 r ilte dF hea l e Ste 1 0 Special Cases In/Out Potential Current Natural Origin Abundance Recovery Priority 21 Low Moderate el Ste ter Win to ica Ind SP V d hea R ng ori ni t o rM 2 1 0 Low Moderate Yo B un Sc Cla ig Cgs B ap t sk re ay El oc G poo ani ek ho ra se e C la m ys ck a a L m M n U Co San as ill C w d C ow l itz y is li t S p C NF F T Ti lt us z ow T ou on ee ou tl e N Ka m tl EF F L l am an e e Lo Wa Sa Le wis a U we sh l m wis pp r ou o er Go ga n G rg l H org e oo e d Winter Steelhead es riti rio P ve lati 3 Fry/Parr Index & Distribution Migration/ Spawn Timing Juvenile Migrants Spawner & adult recruit abundance; adult age, sex, origin, and distribution s 3 C M ill ow li C tz Yo isp un us gs Bi Ba g y C C ree la ts k Sc kan ap i e po os e G C r a la ck ys am as Sa SF nd y To N utl F e C Tou ow tl ee e m Ka an la EF ma Lo Le we w r G is or ge El Ho oc od ho m an N F L W ew as i ho s ug L Co al wl itz Ti lt S on U al m pp er on G or ge U C M il ow l li C tz is Bi pu s g C C ree la ts k C ka la ck ni e am N F as C Tou ow tl ee e m Ka an Yo l a un ma g Sc s B ap ay po os e Sa nd y El Ho oc o ho d m an N F Le w is G r a SF y s To u EF tl e Lo Le we w r G is or ge W Ti lt as on ho ug L a U Cow l pp er l itz G or Sa ge lm on U Winter Steelhead Total Score for Winter Steelhead - Adults and Juveniles 1600 1400 1200 1000 800 600 400 200 0 Total Score for Winter Steelhead - Adults 60 50 40 30 20 10 0 22 C M ill ow li C tz is Bi pu s g C C ree la ts k C kan la ck i e am N F as C Tou ow tl ee e m Ka an la m a Yo H un ood g Sc s B ap ay p El oo o c se ho m an Sa N nd y F Le w is G ra ys Ti SF lto n To u EF tl e Lo Le we w r G is or g L Co e W wl as itz U hou pp er gal G or Sa ge lm on U Winter Steelhead Total Score for Winter Steelhead - Juveniles 30 25 20 15 10 5 0 23 Summer Steelhead 24 Summer Steelhead Total Score for Summer Steelhead - Adults and Juveniles 2500 2000 1500 1000 500 0 Wind Kalama Washougal EF Lewis Hood NF Lewis Hood NF Lewis Total Score for Summer Steelhead - Adults 90 80 70 60 50 40 30 20 10 0 Wind Kalama Washougal EF Lewis 25 Summer Steelhead Total Score for Summer Steelhead - Juveniles 30 25 20 15 10 5 0 Wind Kalama EF Lewis Washougal 26 Hood NF Lewis
