Relative Weight Index for White-tailed Deer
advertisement
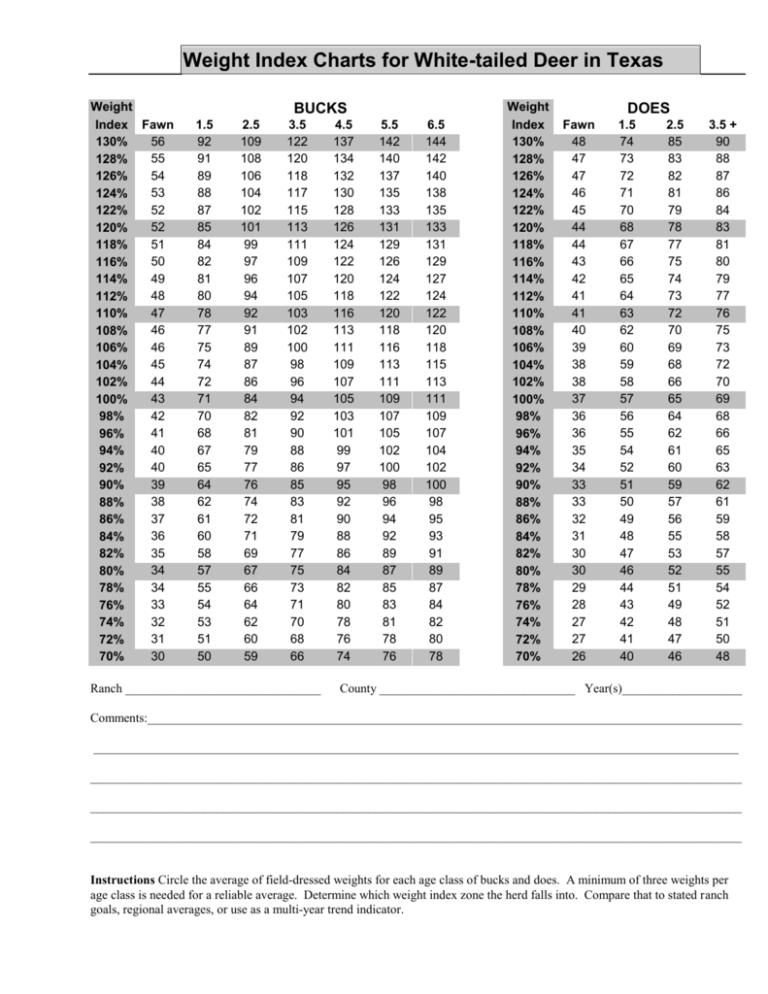
Weight Index Charts for White-tailed Deer in Texas Weight Index Fawn 56 130% 55 128% 54 126% 53 124% 52 122% 52 120% 51 118% 50 116% 49 114% 48 112% 47 110% 46 108% 46 106% 45 104% 44 102% 43 100% 42 98% 41 96% 40 94% 40 92% 39 90% 38 88% 37 86% 36 84% 35 82% 34 80% 34 78% 33 76% 32 74% 31 72% 30 70% BUCKS 1.5 92 91 89 88 87 85 84 82 81 80 78 77 75 74 72 71 70 68 67 65 64 62 61 60 58 57 55 54 53 51 50 2.5 109 108 106 104 102 101 99 97 96 94 92 91 89 87 86 84 82 81 79 77 76 74 72 71 69 67 66 64 62 60 59 3.5 122 120 118 117 115 113 111 109 107 105 103 102 100 98 96 94 92 90 88 86 85 83 81 79 77 75 73 71 70 68 66 Ranch _______________________________ 4.5 137 134 132 130 128 126 124 122 120 118 116 113 111 109 107 105 103 101 99 97 95 92 90 88 86 84 82 80 78 76 74 5.5 142 140 137 135 133 131 129 126 124 122 120 118 116 113 111 109 107 105 102 100 98 96 94 92 89 87 85 83 81 78 76 6.5 144 142 140 138 135 133 131 129 127 124 122 120 118 115 113 111 109 107 104 102 100 98 95 93 91 89 87 84 82 80 78 Weight Index 130% 128% 126% 124% 122% 120% 118% 116% 114% 112% 110% 108% 106% 104% 102% 100% 98% 96% 94% 92% 90% 88% 86% 84% 82% 80% 78% 76% 74% 72% 70% DOES Fawn 48 47 47 46 45 44 44 43 42 41 41 40 39 38 38 37 36 36 35 34 33 33 32 31 30 30 29 28 27 27 26 1.5 74 73 72 71 70 68 67 66 65 64 63 62 60 59 58 57 56 55 54 52 51 50 49 48 47 46 44 43 42 41 40 2.5 85 83 82 81 79 78 77 75 74 73 72 70 69 68 66 65 64 62 61 60 59 57 56 55 53 52 51 49 48 47 46 3.5 + 90 88 87 86 84 83 81 80 79 77 76 75 73 72 70 69 68 66 65 63 62 61 59 58 57 55 54 52 51 50 48 County _______________________________ Year(s)___________________ Comments:______________________________________________________________________________________________ ______________________________________________________________________________________________________ _______________________________________________________________________________________________________ _______________________________________________________________________________________________________ _______________________________________________________________________________________________________ Instructions Circle the average of field-dressed weights for each age class of bucks and does. A minimum of three weights per age class is needed for a reliable average. Determine which weight index zone the herd falls into. Compare that to stated ranch goals, regional averages, or use as a multi-year trend indicator. Using Field-Dressed Weights as a Nutritional Index for White-tailed Deer Steve Nelle, NRCS Biologist, San Angelo Good harvest records are an essential part of a good deer management program. These records will include ages and weights on all bucks and does harvested. This information can be used to tell the rancher or manager important things about his deer herd and deer habitat. Lighter weights normally indicate habitat and nutritional problems, while higher weights are indicative of good nutrition and good habitat. The Weight Index Charts on the reverse side list a range of field-dressed weights for each age of deer from 70% to 130% of the state-wide average. The 100% weights are the average of six regions in Texas and generally indicate adequate nutrition. An index of 80% would indicate that weights are 20% below the state average, while an index of 120% would indicate that weights are 20% above the state average. These averages were derived from over 11,000 deer for three different years. Data was collected by TPWD. Since does reach their mature body size at an earlier age, all does 3.5 years of age and older can be averaged together. For bucks, each age class should be evaluated separately since they continue to increase in body size through age 6.5. The chart is not intended to evaluate the quality of individual deer, but rather the average for the population. At least three deer are needed to get a reliable average for an age class. Avoid the temptation to use only the heavier deer to make an average. All bucks and does should be weighed on good scales (not estimated). All deer should be aged by someone experienced in tooth wear patterns. By plotting the average weights for several years, the manager can gain a good understanding of the nutrition his habitat is providing. Interpretation of a single year weight index should be made with caution. A dry summer and fall will cause harvest weights to be lower even in a well-managed herd. A wet summer or fall or a good acorn or mesquite bean crop will cause weights to be higher than normal. Notations of this sort should be recorded in the comments. Weight indexes will tell the rancher or manager if his herd is performing at the desired level. If the goal is to produce higher numbers of deer with lower antler potential, an index of 90% may be appropriate; however the habitat will not improve. If the goal is to produce large-antlered bucks at the expense of numbers, the weight index should be in 110% range and above. For does, even in extremely well managed habitat, the index will seldom be above 110% due to increased fawning and twinning rates. Refer to the chart below for general characteristics of each weight index: Weight Index Herd Characteristics Habitat Characteristics 70% - 80% Severely overpopulated Poor body condition Low fawn crops Spikes very common Poor antler development potential Very limited available food supply Poor quality nutrition Over-use of deer food plants Browse lines; Severe hedging 80% - 90% Somewhat overpopulated Medium fawn crops Spikes common especially in dry years Fair antler development potential Low to moderate supply of deer food plants Over-use of better plants Near 100% At or near carrying capacity Good fawn crops most year Spikes present but not numerous Good antler development potential Good supply and quality of deer food plants Most food plants not over-used 110% - 120% (Bucks only) Below maximum carrying capacity Good antlers even in dry years Some trophy potential Very good supply, quality and variety of deer food plants 120% - 130%+ (Bucks only) Well below maximum carrying capacity Excellent antler development Good trophy potential Excellent deer habitat providing high nutrition
