Supplementary Information (doc 2756K)
advertisement
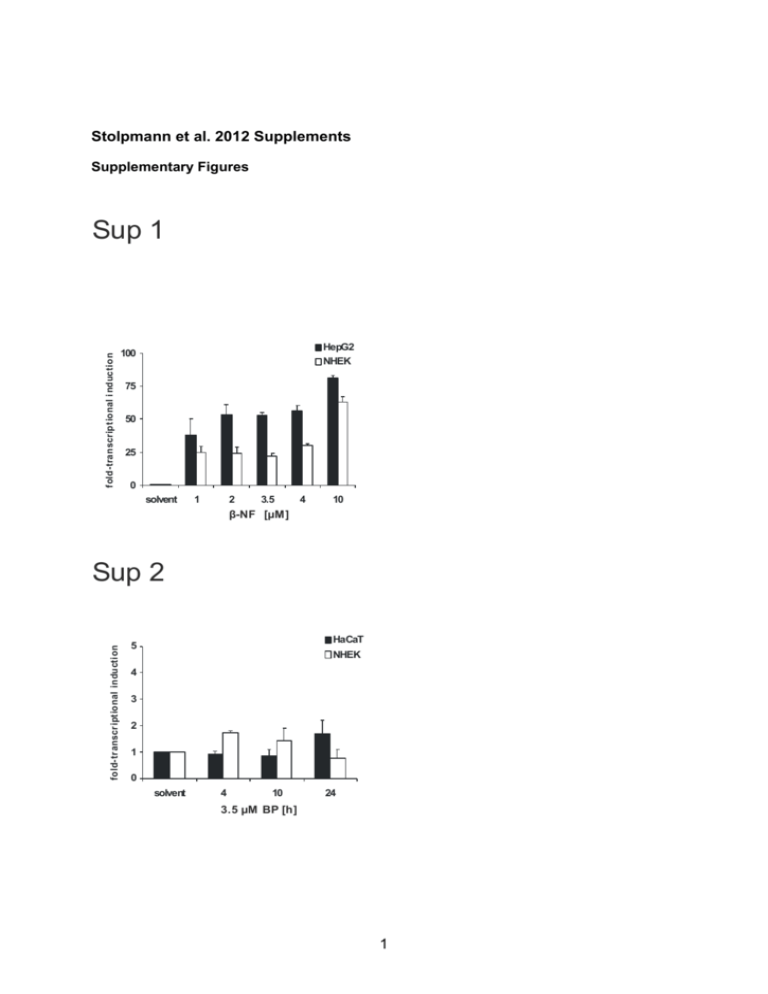
Stolpmann et al. 2012 Supplements Supplementary Figures fold-transcriptional i nduction Sup 1 HepG2 NHEK 100 75 50 25 0 solvent 1 2 3.5 4 10 β-NF [µM] fold-tr anscr iptional inducti on Sup 2 HaCaT 5 NHEK 4 3 2 1 0 solvent 4 10 24 3.5 µM BP [h] 1 Sup 3 CD95 NHEK HaCaT AhR e.V. 800 HaCaT AhR s.d. 600 400 200 0 - + + BP [3.5 µM] β-NF [10 µM] mean fluorescence intensity mean fluorescence intens ity HaCaT KBM 1000 KBM- 800 600 400 200 0 + - BP [3.5 µM] TRAIL-R1 800 NHEK HaCaT AhR e.V. HaCaT AhR k.d. 600 400 200 0 - + + BP [3.5 µM] β-NF [10 µM] mean fluorescence intensity mean fluorescence intensity HaCaT KBM 1000 KBM- 800 600 400 200 0 + - BP [3.5 µM] TRAIL-R2 800 NHEK HaCaT AhR e.V. HaCaT AhR k.d. 600 400 200 0 - + - BP [3.5 µM] + β-NF [10 µM] 2 mean fluorescence intensity mean fluorescence inte nsity HaCaT KBM 1000 KBM- 800 600 400 200 0 - + BP [3.5 µM] Sup 4 solvent 10 µM alpha NF 160 160 solvent BP 120 viability [%] viability [%] 120 solvent BP 80 80 40 40 0 0 - + - + - + - + CD95L [20 ng/ml] CD95L [100 ng/ml] TRAIL [20 ng/ml] TRAIL [100 ng/ml] - + - + - + - Sup 5 A B KRT1 keratin 1 keratin 5 1,8 Expression (a.u.) Rel.Rel. expression (, a.u.) Expression (a.u.) Rel.Rel. expression (, a.u.) 35 35 35 30 30 30 25 25 25 20 20 20 15 15 15 10 10 10 555 KBM+ 1,2 1 0,8 0,6 0,4 0,2 C KBM+ -KBM- KBM KBM- KBM- KBM D KRT10 keratin 10 2,5 2,5 2.5 Rel. Rel.expression Expression(,(a.u.) a.u.) Rel. Expression (a.u.) 1,6 1,4 0 0 0 40 35 35 KRT5 30 25 20 15 10 5 KBM- IVL involucrin 2 2 1,5 1,5 1.5 1 1 0,5 0.5 0,5 0 0 KBM KBM+ KBM+ KBM- KBM- KBM 3 KBMKBMKBM- + 4 Sup 7 A - + MG-132 160 160 solv ent BP 120 viability [%] viability [%] 120 80 40 80 40 0 0 - + - B + - + - + CD95L [20 ng/ml] CD95L [100 ng/ml] TRAIL [20 ng/ml] TRAIL [100 ng/ml] - - + - + - + - + + MG-132 160 160 solve nt BP solvent BP 120 viability [%] 120 viability [%] solvent BP 80 80 40 40 0 0 - + - + - + - + CD95L [20 ng/ml] CD95L [100 ng/ml] TRAIL [20 ng/ml] TRAIL [100 ng/ml] 5 - + - + - + - + Captions and legends to supplementary figures Supplementary Figure 1: Induction of CYP1A1 by β-NF in primary human keratinocytes or HepG2 cells Transriptional induction of the CYP1A1 gene by β-NF: Transcripts of CYP1A1 were measured by real-time PCR in primary human keratinocytes (NHEK) and HepG2 cells after exposure to β-NF for 6 h. Control cells were treated with solvent (0.1% DMSO) only. Total RNA was isolated and a real-time PCR analysis was performed as described in the section Materials and Methods. Supplementary Figure 2: Levels of CD95 are not affected by BP treatment in primary human keratinocytes or HaCaT cells Transcriptional induction of the CD95 gene by BP: Transcripts of CD95 were measured by real-time PCR in primary human keratinocytes (NHEK) and HaCaT cells after exposure to 3.5 µM BP as indicated. Control cells were treated with solvent (0.1% DMSO) only. Total RNA was isolated and a real-time PCR analysis was performed as described in the section Materials and Methods. Supplementary Figure 3: Expression of CD95, TRAIL-R1 and TRAIL-R2 in HaCaT cells and NHEK HaCaT cells [AhR e.v.: parental (empty) control vector (black bars) and AhR k.d.: shRNA AhR knock-down (white bars)] were treated with BP (3.5 µM), β-NF (10 µM) or 0.1% DMSO (solvent) for 48 h as indicated (left side). NHEK [undifferentiated, KBM (black bars) and differentiating, KBM- (white bars)] were treated with BP (3.5 µM) or 0.1% DMSO (solvent) for 48 h. FACS analysis for receptor expression was carried out using labelled anti-CD95 [top], anti-TRAILR1 (DR4) [middle] or anti-TRAILR2 (DR5) [bottom] reagents obtained from R & D Systems GmbH. The mean specific fluorescence intensities were calculated by subtracting 6 the mean fluorescence of specific isotype controls. Values represent means±S.D. of three independent experiments. Supplementary Figure 4: HaCaT cells were pre-exposed to 10 µM -napthoflavone (-NF) for 6 h and subsequently treated with 3.5 µM BP (white bars) or 0.1% DMSO (black bars) for 48 h. This was followed by a 24 h treatment with CD95L or TRAIL as indicated. Cell viability was then determined by crystal violet staining. Values represent means ± S.D. of three independent experiments. Supplementary Figure 5: Expression of NHEK differentiation markers in cells exposed to medium lacking growth supplements NHEK were initially cultured in keratinocyte growth medium (KBM). After reaching confluence, media were changed, using again KBM (KBM) or KBM medium lacking all supplements except Bovine Pituitary Extract and CaCl2 (KBM―) to trigger differentiation. Cultures were maintained for at least 24 h. Expression of keratinocyte cell markers was analysed by realtime PCR (see Supplemental Table 1 for primer sequences) Supplementary Figure 6: Effects of AhR agonists on cytokine expression in HaCaT cells (A) HaCaT AhR parental (empty vector) control cells and AhR shRNA knock-down cells were treated with 3.5 µM BP, 10 µM β-NF or 0.1 % DMSO for 48 h and expression of cytokoines was carried out using real-time PCR (see Supplemental Table 1 for primer sequences). Supplementary Figure 7: AhR-dependent ubiquitination does not affect the level of apoptosis in BP-treated HaCaT cells (A) HaCaT AhR empty vector (e.v.) control cells were pretreated with 3.5 µM BP (white bars) or 0.1% DMSO (black bars) for 48 h and at t=45 h 1 µM MG-132 was added (right). Cells 7 were subsequently exposed to different concentrations of CD95L or TRAIL for further 24 h without (left) or with (right) 1 µM MG-132. Cell viability was then determined by crystal violet staining as described in the section Material and Methods. (B) HaCaT shRNA AhR knock-down (k.d.) cells were pretreated with 3.5 µM BP (white bars) or 0.1% DMSO (black bars) for 48 h and at t=45h 1 µM MG-132 was added (right). Cells were subsequently exposed to different concentrations of CD95L or TRAIL for further 24 h without (left) or with (right) 1 µM MG-132. Cell viability was then determined by crystal violet staining as described in the section Material and Methods. Supplemental Table 1: Primers used for real-time PCR analysis Gene Accession Fw primer Rev Primer Involucrin NM_005547.2 ttgcttcctgtagagcacca tagcggacccgaaataagtg Keratin 1 NM_006121.3 atttctgagctgaatcgtgtgatc ctgatggactgctgcaagtt Keratin 5 NM_000424.3 caacccactagtgcctggtt gacacacttgactggcgaga Keratin 10 NM_000421.3 atgagctgaccctgaccaag tcacatcaccagtggacaca CD95L NM_000639.1 ggcctgtgtctccttgtgat tgccagctccttctgtaggt TRAIL NM_001190942.1 aaggaagggcttcagtgacc tgcaggagcactgtgaagat Interferon- NM_000619.2 gtccaacgcaaagcaataca atattgcaggcaggacaacc Tumor necrosis NM_000594.2 cctgtgaggaggacgaacat ggttgagggtgtctgaagga Interleukin 1-β NM_000576.2 ggagaatgacctgagcacct cgtgcacataagcctcgtta Interleukin 6 NM_000600.3 attctgcgcagctttaagga atctgaggtgcccatgctac Interleukin 10 NM_000572.2 gagaacagctgcacccactt actctgctgaaggcatctcg Interleukin 17A NM_002190.2 gcccctcagagatcaacaga gccctaggagtgttgcttga factor-α 8
