Lab 3: Diffusion and Osmosis
advertisement
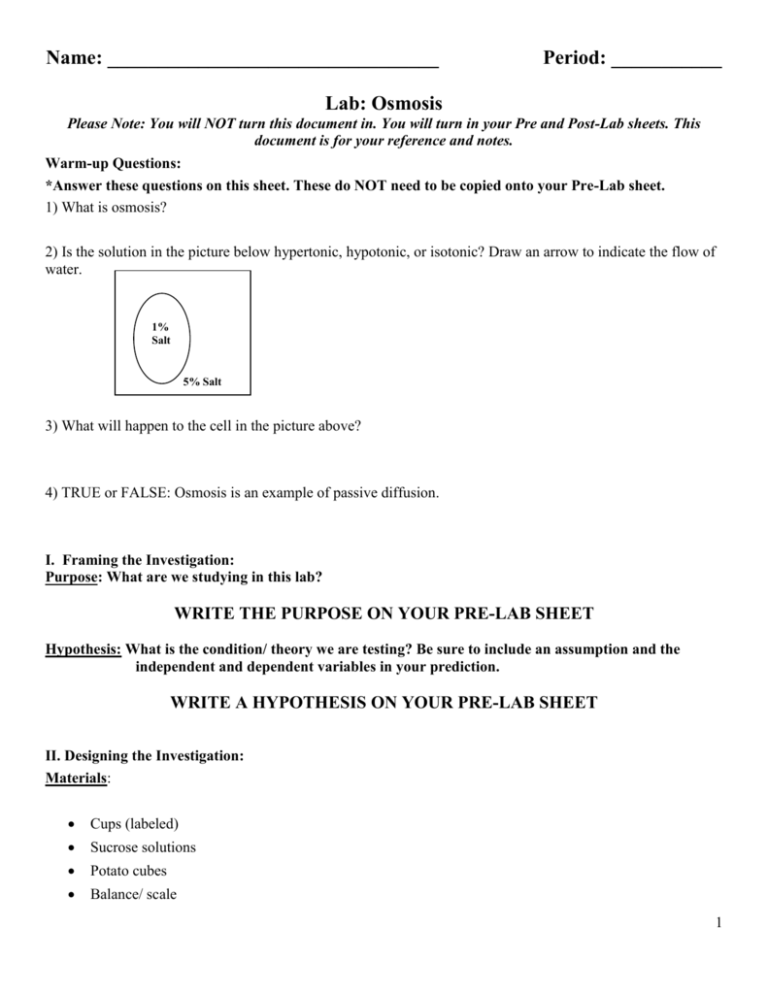
Name: _________________________________ Period: ___________ Lab: Osmosis Please Note: You will NOT turn this document in. You will turn in your Pre and Post-Lab sheets. This document is for your reference and notes. Warm-up Questions: *Answer these questions on this sheet. These do NOT need to be copied onto your Pre-Lab sheet. 1) What is osmosis? 2) Is the solution in the picture below hypertonic, hypotonic, or isotonic? Draw an arrow to indicate the flow of water. 1% Salt 5% Salt 3) What will happen to the cell in the picture above? 4) TRUE or FALSE: Osmosis is an example of passive diffusion. I. Framing the Investigation: Purpose: What are we studying in this lab? WRITE THE PURPOSE ON YOUR PRE-LAB SHEET Hypothesis: What is the condition/ theory we are testing? Be sure to include an assumption and the independent and dependent variables in your prediction. WRITE A HYPOTHESIS ON YOUR PRE-LAB SHEET II. Designing the Investigation: Materials: Cups (labeled) Sucrose solutions Potato cubes Balance/ scale 1 Background: The cell is the basic unit of structure and function of living things. Eukaryotic cells (with a nucleus) are organized into three regions: the nucleus at the center which is surrounded by the cytoplasm, and plasma membrane. The nucleus contains the genetic material (DNA) which stores all the information to build a complete organism. The cytoplasm is a watery region that contains all of the cells specialized organelles. These organelles carry out most of the cells activities. The cytoplasm is separated from the external environment by the plasma membrane. The plasma membrane plays an important role in determining the internal environment (homeostasis) of the cell because it controls what enters and leaves the cell. The cell membrane contains pores (holes) which allow small molecules to pass through. In this lab you will be studying osmosis using potatoes. Osmosis is the diffusion (passive movement) of water molecules through a selectively permeable membrane (a membrane that allows for diffusion of selected solutes and water) from a region of higher water potential (high concentration) to a region of lower water potential (low concentration) until an equilibrium is reached. For this lab, the sucrose is the solute, water is the solvent, and the solutions are mixtures of varying amounts of sucrose dissolved in water. Potato cell membranes are the selectively permeable membranes. For this lab, the concentration of sucrose solution resulting in a net mass change of 0% will be isotonic solution, and thus, your control group. The DI H2O is not necessarily your control group! Procedure: Osmosis Lab (2 Days) In this experiment we will use potato slices to investigate the relationship between solute concentration and the movement of water through a selectively permeable membrane by the process of osmosis. When a potato containing a sucrose solution is placed in distilled water the potato will accumulate water as a result of osmosis. Because there is a higher water potential outside the potato than inside the potato, water will diffuse into the potato. In the absence of pressure, the solution outside the potato is said to be hypotonic relative to the solution in the potato. The solution inside the potato with a higher solute concentration is hypertonic to the solution outside the potato. If solute is added to the water outside the potato, you decrease the water potential of the solution outside the potato. It should therefore be possible to add just the right amount of solute to the water so that the water potential outside the potato is the same as the water potential inside the potato. The two solutions are isotonic relative to each other. In this case, no NET water movement will occur. If you continue to add more solute to the water outside the potato, the water potential outside the potato will decrease to the point where the solution outside the bag is hypertonic to the solution inside the potato. The NET movement of water will then be in the opposite direction, from inside (where the water potential is higher) to outside the potato (where water potential is lower). Day 1: 1) Label your six cups DI H2O, 0.2M Sucrose, 0.4 M Sucrose, 0.6M Sucrose, 0.8M Sucrose, and 1.0M Sucrose. 2) Pour ~50ml of each solution into an appropriately labeled cup. Be careful not to mix them up. 3) Obtain 6 equally sized slices of potato. Determine the mass of each potato slice and record the initial mass in the data table. Be careful not to mix them up. Mass one potato slice at a time and place it directly into the appropriate cup. 4) Squeeze each potato slice and record your qualitative observations about its flexibility. 2 Day 2: 1) Remove the potato slices from each cup. Be careful not to mix them up. Mass one potato slice at a time then return it to the appropriate cup. 2) Determine the final mass and record in Data Table 2: Osmosis Results 3) Calculate the percent change using the % change equation below. 4) Squeeze each potato slice and record your qualitative observations about its flexibility. % change = Final Mass - Initial Mass Initial Mass X 100 III. Collecting and Presenting Data: Results: *You may record initial observations here but be sure to copy this IN YOUR OWN HANDWRITING onto your Post-Lab sheet! Data Table 1: Osmosis Results Initial mass (gm) Solute (gm/ml) Final Mass (gm) % Change Class Average % Change DI H20 (0.00 gm/ml) 0.2 M Sucrose (0.068 gm/ml) 0.4 M Sucrose (0.137 gm/ml) 0.6 M Sucrose (0.210 gm/ml) 0.8M Sucrose (0.274 gm/ml) 1.0M Sucrose (0.342 gm/ml) 3 Graph: Do not graph your groups’ data. On your Post-Lab sheet, graph the results for the CLASS AVERAGE ONLY. In order to do so, the 0 axis line should actually be in the middle of your graph. The y axis above this line should be labeled % increase in mass while the y axis below this line should be labeled % decrease in mass. The x axis is the solute concentration (gm/ml) within the beaker. IV. Analyzing and Interpreting Results: Analysis Questions - Osmosis Lab: Molarity or Molar Concentration (M) is equal to the number of grams of solute divided by the number of milliliters of solvent. Determine the molar concentration of the potato slices. This would be the sucrose molarity in which the mass of the potato slices does not change. To find this, draw the straight line on your graph that best fits your data. The point at which this line crosses the x axis represents the molar concentration of sucrose with a water potential that is equal to the potato tissue water potential. At this concentration, there is no net gain or loss of water from the tissue. 1) What is the Molar concentration of the potato cells? ___________ 2) Which solution served as the control for this experiment & why? 3) In which solutions was there a greater solute concentration outside of the potato cells (which solutions were hypertonic relative to the potato cells)? 4) In which direction did water move through the cell membranes of the potato slices in the solutions listed above? 5) In what type of solution do plant cells do best & why? The Discussion, Experimental Error, and Going Further will be completed on your Post-Lab Sheet. Follow the directions on your Formal Lab Report Instructions handout (can be accessed via the PreAP Biology website under Major Labs and Projects) 4
