8.F.A.1 Lesson 2 Show Me the Money
advertisement
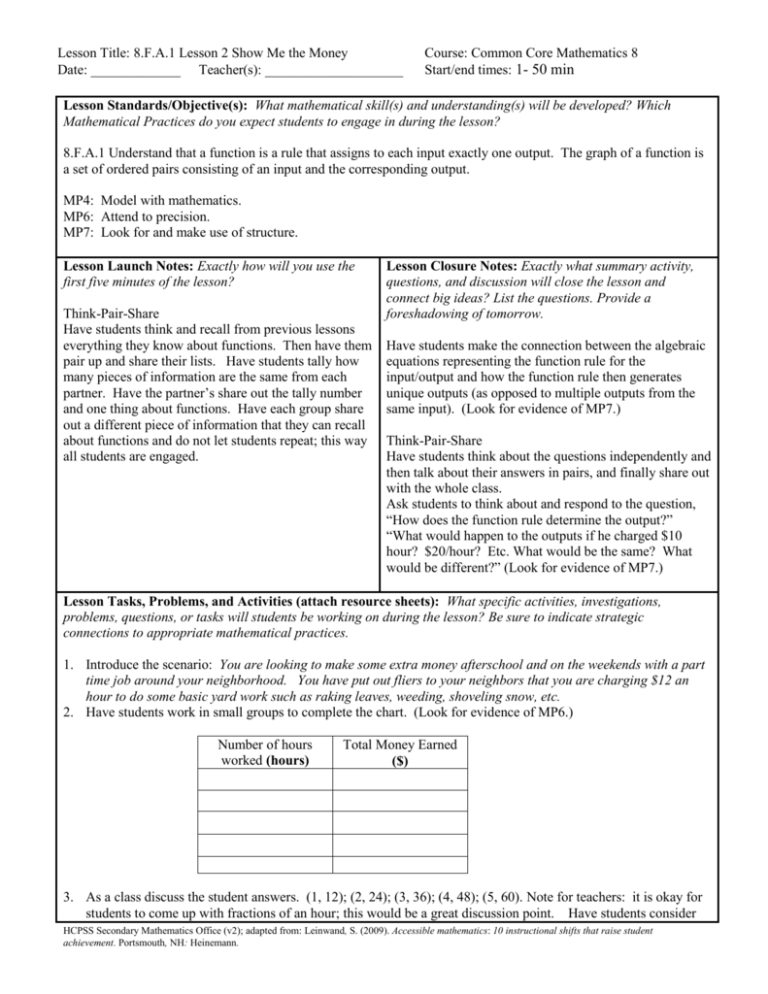
Lesson Title: 8.F.A.1 Lesson 2 Show Me the Money Date: _____________ Teacher(s): ____________________ Course: Common Core Mathematics 8 Start/end times: 1- 50 min Lesson Standards/Objective(s): What mathematical skill(s) and understanding(s) will be developed? Which Mathematical Practices do you expect students to engage in during the lesson? 8.F.A.1 Understand that a function is a rule that assigns to each input exactly one output. The graph of a function is a set of ordered pairs consisting of an input and the corresponding output. MP4: Model with mathematics. MP6: Attend to precision. MP7: Look for and make use of structure. Lesson Launch Notes: Exactly how will you use the first five minutes of the lesson? Think-Pair-Share Have students think and recall from previous lessons everything they know about functions. Then have them pair up and share their lists. Have students tally how many pieces of information are the same from each partner. Have the partner’s share out the tally number and one thing about functions. Have each group share out a different piece of information that they can recall about functions and do not let students repeat; this way all students are engaged. Lesson Closure Notes: Exactly what summary activity, questions, and discussion will close the lesson and connect big ideas? List the questions. Provide a foreshadowing of tomorrow. Have students make the connection between the algebraic equations representing the function rule for the input/output and how the function rule then generates unique outputs (as opposed to multiple outputs from the same input). (Look for evidence of MP7.) Think-Pair-Share Have students think about the questions independently and then talk about their answers in pairs, and finally share out with the whole class. Ask students to think about and respond to the question, “How does the function rule determine the output?” “What would happen to the outputs if he charged $10 hour? $20/hour? Etc. What would be the same? What would be different?” (Look for evidence of MP7.) Lesson Tasks, Problems, and Activities (attach resource sheets): What specific activities, investigations, problems, questions, or tasks will students be working on during the lesson? Be sure to indicate strategic connections to appropriate mathematical practices. 1. Introduce the scenario: You are looking to make some extra money afterschool and on the weekends with a part time job around your neighborhood. You have put out fliers to your neighbors that you are charging $12 an hour to do some basic yard work such as raking leaves, weeding, shoveling snow, etc. 2. Have students work in small groups to complete the chart. (Look for evidence of MP6.) Number of hours worked (hours) Total Money Earned ($) 3. As a class discuss the student answers. (1, 12); (2, 24); (3, 36); (4, 48); (5, 60). Note for teachers: it is okay for students to come up with fractions of an hour; this would be a great discussion point. Have students consider HCPSS Secondary Mathematics Office (v2); adapted from: Leinwand, S. (2009). Accessible mathematics: 10 instructional shifts that raise student achievement. Portsmouth, NH: Heinemann. Lesson Title: 8.F.A.1 Lesson 2 Show Me the Money Course: Common Core Mathematics 8 Date: _____________ Teacher(s): ____________________ Start/end times: 1- 50 min what it would look like if they worked 1.5 hours. This will have to be a consideration for the scales of the graph when students begin the graphing portion of the activity. 4. Have half of the students break into pairs work together to create a graph using the Show me the Money Graphing Student Resource Sheet from the table they have completed. Students should collaborate with each other, discussing the graph they are creating. (Look for evidence of MP4.) 5. Have the other half of the students break out into pairs to complete the Show Me the Money Student Resource sheet. 6. Then have students switch. 7. Have the pairs share out to the whole class. Ask each pair to share a different part of their graph or of their equation. For example, “What is on the horizontal axis?” “What scale did you choose to use, and why?” “Is the graph showing a pattern?” “Is this function linear?” “What did you get for your equation?” “Do all values make sense in the context of the problem?” Here the teacher should be checking for accuracy. The bounds and scales need not be the same, but they should be reasonable for the given data. (Look for evidence of MP6.) 8. Have two pairs join together to make groups of four students. Give each group a poster. Groups are going to create posters together that should include a table, graph, and a written algebraic expression representing the possible money you can earn by doing yard work afterschool and on weekends. Have each group come up with a maximum amount of hours they are willing to work or a maximum amount of money they are able to make and how these values relate to one another. (Look for evidence of MP4.) 9. Each group will display and present their poster. The posters will remain on the walls of the classroom for a Gallery Walk. 10. The students will take a Gallery Walk around the classroom to record any commonalities or differences that they identify after reviewing the posters prepared by each group. As the teacher, you may need to help the students see the connection between the pattern in the graph and the total amount earned. Evidence of Success: What exactly do I expect students to be able to do by the end of the lesson, and how will I measure student success? That is, deliberate consideration of what performances will convince you (and any outside observer) that your students have developed a deepened and conceptual understanding. Students will be able to generate an additional scenario for a real-world input/output function table situation. Additionally, with the new scenario students will be able to explain what the input means in relation to the output of the function. (Look for evidence of MP7.) Notes and Nuances: Vocabulary, connections, common mistakes, typical misconceptions (and how they will be addressed), etc. Key Vocabulary: x-coordinate, y-coordinate, ordered pairs, input, output Connections: Students will need prior understanding of graphing points on the coordinate plane to solve real-world and mathematical problems from standards 5.G.1 and 5.G.2. Students will need prior understanding of evaluating expressions at specific values of their variables from standard 6.EE.2.C. Students will need prior understanding of using variables to represent number and writing expressions and equations when solving a real-world mathematical problem from standard 6.EE.6 and 6.EE.7. Misconceptions: Some students may need help understanding what the coordinate pairs mean with respect to the original problem. They may get caught up in the graphing and forget that each x-coordinate represents the number of hours of yard work and the y-coordinate represents the total amount of money you will earn. Particularly, when students develop their own scenarios, they need to make sure the x and y-coordinates make sense in the context of the problem. HCPSS Secondary Mathematics Office (v2); adapted from: Leinwand, S. (2009). Accessible mathematics: 10 instructional shifts that raise student achievement. Portsmouth, NH: Heinemann. Lesson Title: 8.F.A.1 Lesson 2 Show Me the Money Course: Common Core Mathematics 8 Date: _____________ Teacher(s): ____________________ Start/end times: 1- 50 min Resources: What materials or resources are essential Homework: Exactly what follow-up homework tasks, for students to successfully complete the lesson tasks or problems, and/or exercises will be assigned upon the activities? completion of the lesson? Scenario and Table Graphic Organizer Graph Paper Graphic Organizer Chart paper Markers Gallery Walk Student Sheet Students can use graph paper or a graphing calculator and allow each student to choose one of the following options: 1. Create a new real-world scenario involving an input and an output. Identify, your x- and y-intercepts, write an equation, and graph your function. (Look for evidence of MP4.) 2. Using the following equations and choosing your own method, determine if the equations are linear or nonlinear. Equation 1: y 2x Equation 2: y x 2 . Explain how you arrived at your solution. (Look for evidence of MP7.) Lesson Reflections: How do you know that you were effective? What questions, connected to the lesson standards/objectives and evidence of success, will you use to reflect on the effectiveness of this lesson? How well do the students complete an input/output table for a given function? Are students able to graph a function using input/output coordinate pairs? Are students able to identify the x- and y-axis and do they understand what the axes mean in the context of the problem? Howard County Public Schools Office of Secondary Mathematics Curricular Projects has licensed this product under a Creative Commons Attribution-NonCommercial-NoDerivs 3.0 Unported License. HCPSS Secondary Mathematics Office (v2); adapted from: Leinwand, S. (2009). Accessible mathematics: 10 instructional shifts that raise student achievement. Portsmouth, NH: Heinemann.


