Exercise 1 - Nate`s Spatial Analysis Lab
advertisement
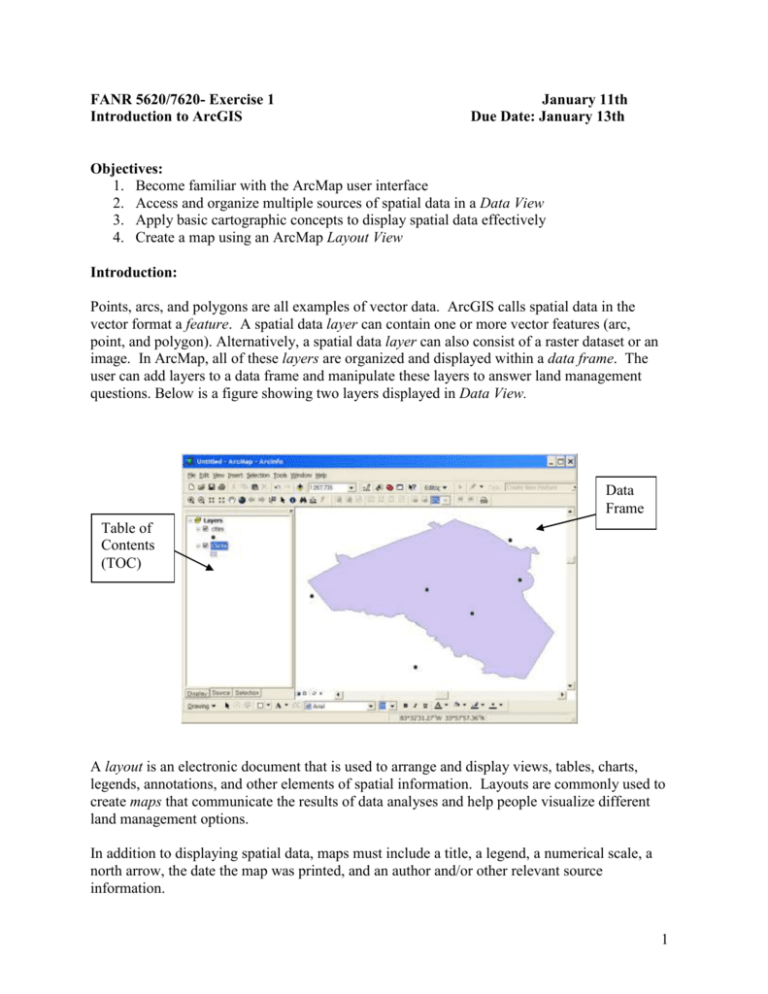
FANR 5620/7620- Exercise 1 Introduction to ArcGIS January 11th Due Date: January 13th Objectives: 1. Become familiar with the ArcMap user interface 2. Access and organize multiple sources of spatial data in a Data View 3. Apply basic cartographic concepts to display spatial data effectively 4. Create a map using an ArcMap Layout View Introduction: Points, arcs, and polygons are all examples of vector data. ArcGIS calls spatial data in the vector format a feature. A spatial data layer can contain one or more vector features (arc, point, and polygon). Alternatively, a spatial data layer can also consist of a raster dataset or an image. In ArcMap, all of these layers are organized and displayed within a data frame. The user can add layers to a data frame and manipulate these layers to answer land management questions. Below is a figure showing two layers displayed in Data View. Data Frame Table of Contents (TOC) A layout is an electronic document that is used to arrange and display views, tables, charts, legends, annotations, and other elements of spatial information. Layouts are commonly used to create maps that communicate the results of data analyses and help people visualize different land management options. In addition to displaying spatial data, maps must include a title, a legend, a numerical scale, a north arrow, the date the map was printed, and an author and/or other relevant source information. 1 Here is the same map as above, but shown in layout view (change between data and layout view under the View main menu). Data Frame All of your activities in ArcMap (creating views, tables and layouts) are stored together in a map document (*.mxd). ArcMap documents do NOT store spatial data. An .mxd contains a list of formatting instructions, query formulae, and pointers to the locations of the data referenced in the data frame(s). This means that if you move the data locations independent of where the map document is located, you will no longer have the correct links to your data when you next open your map. This is important to remember when organizing your data and moving data around. The best way to keep this from becoming an issue is to keep all of the data and maps for specific projects in the same subdirectory. You may at some point experience opening an ArcMap document and encountering red exclamation points in the TOC? Well, this is because ArcMap defaults to storing the “absolute path names to data sources”. This means that if you are working on one machine on a memory stick drive that is mapped to the computer as drive H:\ and save your map file, but then try to access the map on another computer where your memory stick is mapped as G:\ the map file cannot find H:\ We get around this by telling ArcMap to store the “relative path name”. To do this, click on File > Document Properties > Data Source Options and change the click button to “Store relative path names to data sources”. You will need to do this EVERY lab in this class. 2 In this exercise you will work with point, line, and polygon data within a data frame in ArcMap, then create a layout (map). This exercise should give you plenty of practice navigating the ArcMap interface and practicing good map-making skills (good visual communication). Procedures: Begin by opening Windows Explorer and copying the Ex1 folder from the network drive Class\FANR5620_7620\Ex1 (where * - the assigned drive letter - may be different depending if you are an undergraduate or graduate student) to your local C:\workspace folder. This folder contains the data you will need for this lab. The C:\workspace\ folder is the location where you will do all of your work while in lab. When you are done with the lab period, you will copy the entire lab1 folder to your T:\ drive which will allow you to access this folder from any computer in Warnell. To Start ArcMap: 1. Go to “Start”, “Programs”, “ArcGIS”, “ArcMap” 2. In the dialog that appears, select “A new empty map” and click “OK” Doing the exercise Procedures for the lab exercise are given below. WARNING: Save your work – and save FREQUENTLY as you proceed. ArcMap may shut down on you unexpectedly and you should always have a recent saved version of your project to use when you restart. Call the map file Exercise1.mxd (the mxd is the default extension for ArcMap documents) 1) Give the complete drive:\path\filename.mxd to where this ArcMap document is stored on the computer – is this where it should be? If not, use File > Save As to save it to the correct location. Name the Data Frame Name the Data Frame: Athens Area 3 Use the “plus” button to begin adding data to your data frame (where the mapped data is displayed). This will bring up an Add Data window. Navigate to your “Ex1” directory on c:\workspace\ folder and… Add “Clarke_bnd.shp” layer to the Data Frame You will see a “Clarke” entry appear in the window to the left of your view frame. This window is called the Table of Contents (TOC), and lists the spatial data layers that are available within the data frame for display and analysis. You have just placed a pointer in your ArcMap document file that directs the software to "connect" the ArcGIS Shapefile, Clarke_bnd.shp, (the Clarke county boundary data) to the Athens Area Data Frame. Set the Display Units of the Data Frame Right-click on the Data Frame label and select properties. On the “general” tab there will be a place to select the display units. Set the Display Units to meters You may have noticed when you went to add data that there are many pre-defined locations that you could have selected that point to different locations on local and network drives. ArcMap and ArcCatalog call these “Connections” and these can be created to help streamline the navigation process. If you do not already see a connection to C:\workspace\Ex1, create it by clicking on the “plus” button again, and this time clicking on the Yellow arrow that points to the right (if you “mouse-over” that icon, it will bring up an information box that says, “Connect to Folder”) and navigate to c:\workpace\Ex1 and click OK. Now you will have a shortcut to that directory for future labs. Next add the following layers to your Data Frame: clarke_road.shp clarke_streams.shp clarke_lake059.shp cities.shp landuse.shp Note: You can add all of these layers at once by using the shift key and clicking on the layers you want to add to your map. If the layers do not show up on you map, turn them on (check the box in the TOC) so they are drawn in the data frame. Notice that the features are drawn in the same order as they are listed in the TOC. Features at the bottom of the list are drawn first and ones higher up in the list are displayed over those listed lower. Try rearranging the drawing order by clicking on a feature name and dragging it up or down in the data frame list. Before you continue, make sure that all of the features are visible. Note: ArcMap has three different ways to display data in the TOC. If you are clicked on the 4 Display tab in the table of contents, you will be able to re-arrange the order of data. If, however, you are in the Source tab, which shows the stored location of the data being displayed, you will NOT be able to reorder data. Next, you need to change the display parameters to make your map easier to read, and to convey some useful information to viewers. For example, we need to create a legend for roads so that it displays different types of roads (highways, streets, etc.) in different sizes and/or colors. Change the display of the roads layer Right-click on the roads layer in the TOC, then select properties. Select the symbology tab and proceed to experiment with various types of symbols for roads. You will want to ultimately use “categories” and the sub-heading “unique values”. In the value field, choose “type” and click on “add all values” below. Then you can change the symbols one by one to make lines that will indicate the varying types of roads present in the layer. You can change the individual symbols simply by double-clicking on the symbol itself. Change the display of the rivers layer Change the display of the lakes layer Change the display of the cities layer Use a single-symbol legend for these features, which displays all objects of a given feature using the same symbol. Select symbols and colors that show up well, and are clearly distinguishable from one another (you don’t want viewers to confuse roads with streams). You will notice that you can simply click the symbol in the TOC to bring up the symbol editor; there is no need to go to the properties page first for single-symbol changes. 2) Describe your choice of “order” for the drawing of the layers and why you chose that particular order? Working with scale Any map that you use or create has a specific scale that is indicated by a ratio (i.e. 1:24,000, 1:100,000, 1:200,000). These ratios are unitless because both the numerator and the denominator have the same units. The scale 1:24,000 means one inch on the map is equal to the length of 24,000 inches “on the ground”. Likewise, 1:250,000 means that one inch on the map is equal to the length of 250,000 inches “on the ground”. By convention, 1:24,000 is considered a larger “map scale” than 1:250,000, even though a 1:24,000 scale map encompasses a smaller mapped area than 1:250,000 scale map. To keep “map scale” clear in your head, think of the size of the fraction – 1 over 24,000 is a much larger number than 1 over 250,000 and hence it has a larger “map scale.” We will discuss other uses of the word “scale” in lecture. Change the viewing scale Find the measuring tool icon above the View window. Set the viewing scale to 1:24,000 5 3) What is the straight-line distance from Athens to Watkinsville, measured in feet? Now add the “landuse” data layer to your map Change the symbology to make sense. Remember that land use is categorical (discrete types of land use as opposed to continuous elevation data), so chose a symbology scheme that is appropriate to categorical data. Use the attribute table to explore what attribute to use when displaying these data. Now switch to the “layout view” so you can compose a map Create your layout displaying your thematic layer plus: roads, lakes, and rivers in the greater Athens area. Set up the Layout from the main menu under “File”, “Page and Print Setup” Page Size: Orientation: Letter Landscape Add a title to the Map (“Insert”, “Title”) Layout title: (Come up with a brief but descriptive title) Size the title to fit your layout Add a north arrow to the Layout (“Insert”, “North Arrow”) Add a legend to the Layout (“Insert”, “Legend”) Add a graphic scale bar to the Layout (“Insert”, “Scale bar”) Units: Other settings: (miles or kilometers) use a small number of divisions and play with the size until it looks good Add the other features that make a good map composition (source, date, others?) You can use either the drop-down menu “insert” , “text”; or if your drawing toolbar is active (turn it on by right-clicking on the header menu where “File”… “Help” are located), you can simply click on the bold letter A on the toolbar which is the same tool. When you have completed your map document, export the file as a tiff and import the image into a word document. Select File > Export Map, navigate to c:\workspace\Ex1\, save the file as an appropriate name (your choice) and “Save as type: Tiff”. Then open Word and Insert > Image > From File. What to Turn In Please type your answers to questions 1-3 using complete sentences and insert your map into a Word Document. Please print this page before lab or using the GIS/419 printer (NOT PLOTTER) before the start of the next class period. Remember to include your name in the document and on the map. Also remember that while I encourage you to work together to figure things out and discuss solutions in lab, turn in your own work. 6
