IB Physics Measurement objectives in Word
advertisement
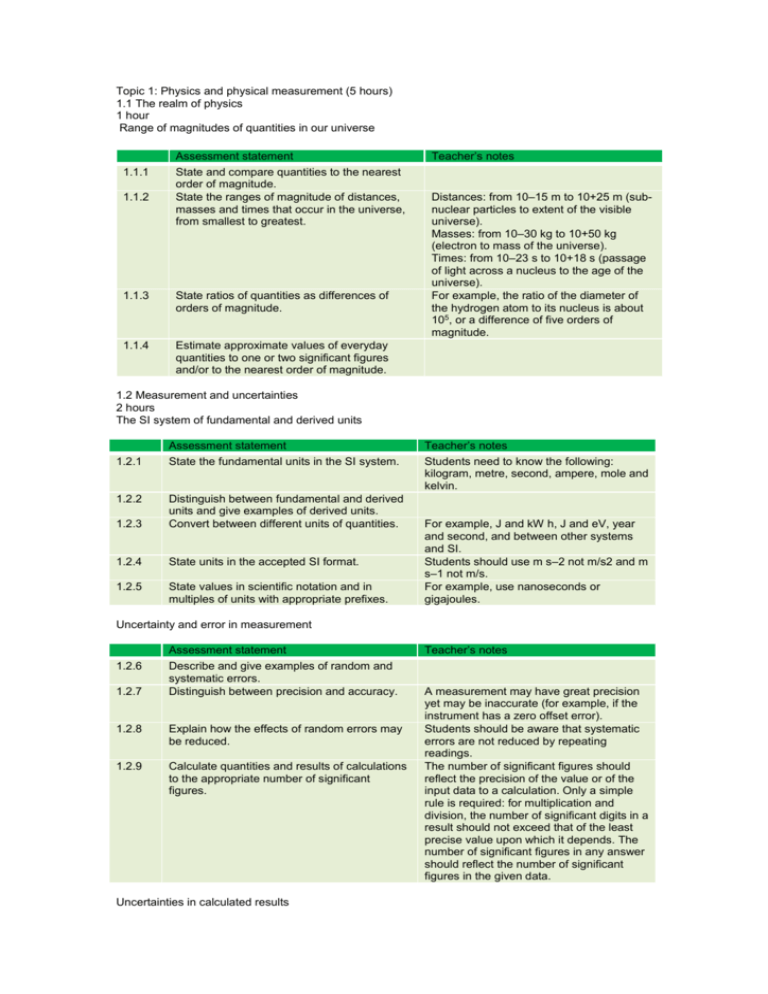
Topic 1: Physics and physical measurement (5 hours) 1.1 The realm of physics 1 hour Range of magnitudes of quantities in our universe 1.1.1 1.1.2 Assessmentstatement statement Assessment State and compare quantities to the nearest order of magnitude. State the ranges of magnitude of distances, masses and times that occur in the universe, from smallest to greatest. 1.1.3 State ratios of quantities as differences of orders of magnitude. 1.1.4 Estimate approximate values of everyday quantities to one or two significant figures and/or to the nearest order of magnitude. Teacher’snotes notes Teacher’s +25 m m Distances: from 10–15 10–15 mmtoto10 10+25 (sub(subnuclear particles to extent of the visible universe). +50 kg kg Masses: from 10–30 10–30 kg kgtoto10 10+50 (electron to mass oftothe (electron mass universe). of the universe). +18 s (passage Times: from 10–23 10–23 s stoto10 10+18 s (passage of light of light across across a nucleus a nucleus to the to the age age of of thethe universe). For example, the ratio of the diameter of the hydrogen atom to its nucleus is about 5, or 105, 10 or aa difference difference of of five five orders orders of of magnitude. 1.2 Measurement and uncertainties 2 hours The SI system of fundamental and derived units 1.2.1 1.2.2 Assessment statement State the fundamental units in the SI system. 1.2.3 Distinguish between fundamental and derived units and give examples of derived units. Convert between different units of quantities. 1.2.4 State units in the accepted SI format. 1.2.5 State values in scientific notation and in multiples of units with appropriate prefixes. Teacher’s notes Students need to know the following: kilogram, metre, second, ampere, mole and kelvin. For example, J and kW h, J and eV, year and second, and between other systems and SI. Students should use m s–2 not m/s2 and m s–1 not m/s. For example, use nanoseconds or gigajoules. Uncertainty and error in measurement 1.2.6 1.2.7 Assessment statement Describe and give examples of random and systematic errors. Distinguish between precision and accuracy. 1.2.8 Explain how the effects of random errors may be reduced. 1.2.9 Calculate quantities and results of calculations to the appropriate number of significant figures. Uncertainties in calculated results Teacher’s notes A measurement may have great precision yet may be inaccurate (for example, if the instrument has a zero offset error). Students should be aware that systematic errors are not reduced by repeating readings. The number of significant figures should reflect the precision of the value or of the input data to a calculation. Only a simple rule is required: for multiplication and division, the number of significant digits in a result should not exceed that of the least precise value upon which it depends. The number of significant figures in any answer should reflect the number of significant figures in the given data. Assessment statement 1.2.10 1.2.11 State uncertainties as absolute, fractional and percentage uncertainties. Determine the uncertainties in results. Teacher’s notes A simple approximate method rather than root mean squared calculations is sufficient to determine maximum uncertainties. For functions such as addition and subtraction, absolute uncertainties may be added. For multiplication, division and powers, percentage uncertainties may be added. For other functions (for example, trigonometric functions), the mean, highest and lowest possible answers may be calculated to obtain the uncertainty range. If one uncertainty is much larger than others, the approximate uncertainty in the calculated result may be taken as due to that quantity alone. Uncertainties in graphs Assessment statement 1.2.12 1.2.13 Identify uncertainties as error bars in graphs. State random uncertainty as an uncertainty range (±) and represent it graphically as an “error bar”. 1.2.14 Determine the uncertainties in the gradient and intercepts of a straight line graph. Teacher’s notes Error bars need be considered only when the uncertainty in one or both of the plotted quantities is significant. Error bars will not be expected for trigonometric or logarithmic functions. Only a simple approach is needed. To determine the uncertainty in the gradient and intercept, error bars need only be added to the first and the last data points. 1.3 Vectors and scalars 2 hours Assessment statement Teacher’s notes 1.3.1 Distinguish between vector and scalar quantities, and give examples of each. A vector is represented in print by a bold italicized symbol, for example, F. 1.3.2 Determine the sum or difference of two vectors by a graphical method. Resolve vectors into perpendicular components along chosen axes. Multiplication and division of vectors by scalars is also required. For example, resolving parallel and perpendicular to an inclined plane. 1.3.3
