PCE_2358_sm_Fig_S1-S2_Tab_S1-S2
advertisement
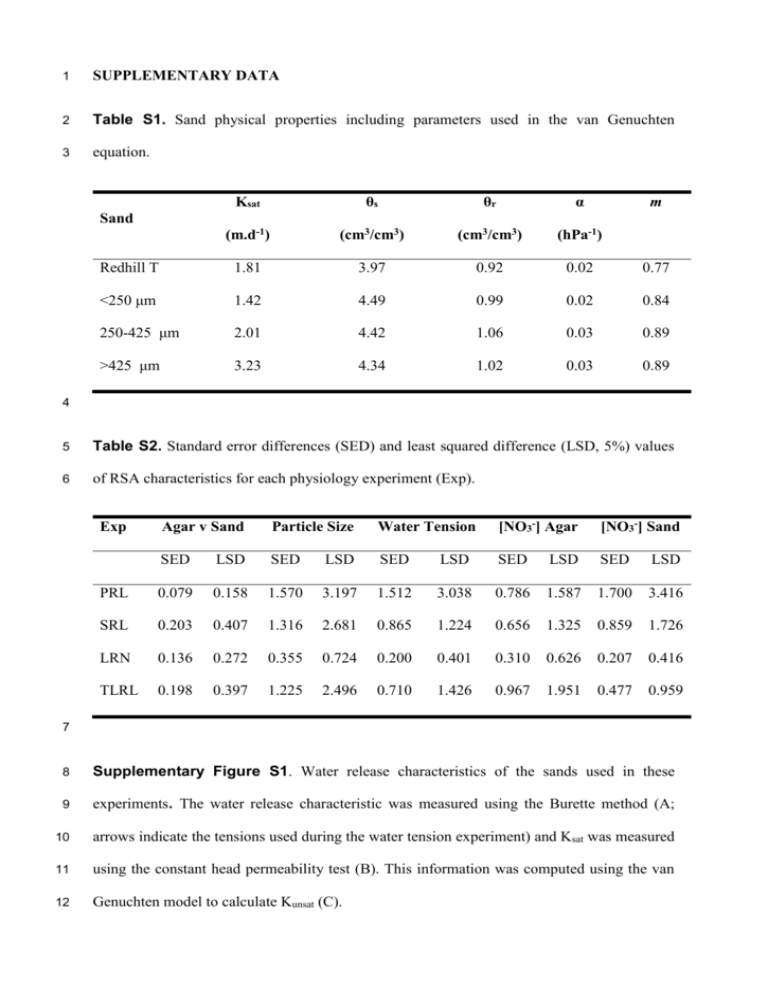
1 SUPPLEMENTARY DATA 2 Table S1. Sand physical properties including parameters used in the van Genuchten 3 equation. Ksat θs θr α (m.d-1) (cm3/cm3) (cm3/cm3) (hPa-1) Redhill T 1.81 3.97 0.92 0.02 0.77 <250 μm 1.42 4.49 0.99 0.02 0.84 250-425 μm 2.01 4.42 1.06 0.03 0.89 >425 μm 3.23 4.34 1.02 0.03 0.89 m Sand 4 5 Table S2. Standard error differences (SED) and least squared difference (LSD, 5%) values 6 of RSA characteristics for each physiology experiment (Exp). Agar v Sand Particle Size Water Tension [NO3-] Agar [NO3-] Sand SED LSD SED LSD SED LSD SED LSD SED LSD PRL 0.079 0.158 1.570 3.197 1.512 3.038 0.786 1.587 1.700 3.416 SRL 0.203 0.407 1.316 2.681 0.865 1.224 0.656 1.325 0.859 1.726 LRN 0.136 0.272 0.355 0.724 0.200 0.401 0.310 0.626 0.207 0.416 TLRL 0.198 0.397 1.225 2.496 0.710 1.426 0.967 1.951 0.477 0.959 Exp 7 8 Supplementary Figure S1. Water release characteristics of the sands used in these 9 experiments. The water release characteristic was measured using the Burette method (A; 10 arrows indicate the tensions used during the water tension experiment) and Ksat was measured 11 using the constant head permeability test (B). This information was computed using the van 12 Genuchten model to calculate Kunsat (C). 13 Supplementary Figure S2. Typical NO3- microelectrode recording obtained from the 14 surface of an Arabidopsis root growing in sand and supplied with a full nutrient solution 15 containing 0.1 mM NO3-. Stable measurements were recorded at the root tip (RT) and 2 mm 16 up (RT-2 mm) from the RT of an intact primary root. The recording shows the calibration of 17 the microelectrode before (t= 0 to 10 min) and after (t= 25 to 32 min) the measurement with 18 solutions of known NO3- activity (100 mM, 10 mM, 1mM, 0.1 mM and 0.01 mM).
