Parameter Plane - Mathematical Association of America
Parameter Plane -- Two Parameter Families of Functions
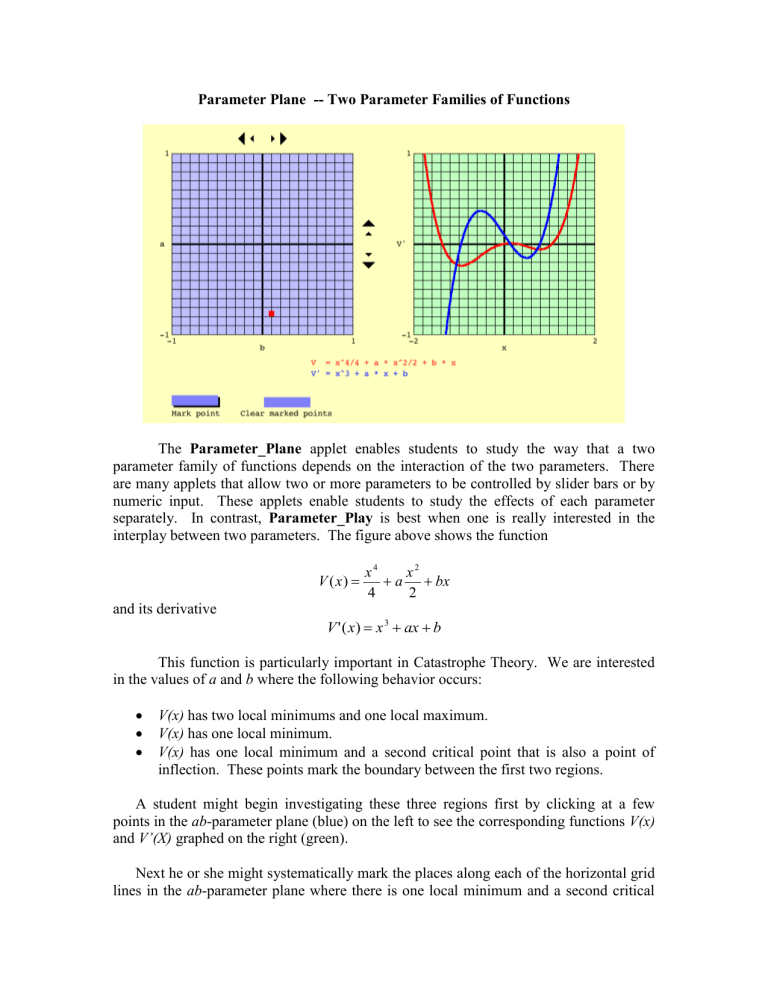
The Parameter_Plane applet enables students to study the way that a two parameter family of functions depends on the interaction of the two parameters. There are many applets that allow two or more parameters to be controlled by slider bars or by numeric input. These applets enable students to study the effects of each parameter separately. In contrast, Parameter_Play is best when one is really interested in the interplay between two parameters. The figure above shows the function
V ( x )
x
4
4
a x
2
2
bx and its derivative
V '( x )
x
3 ax
b in the values of a and b
V(x) has two local minimums and one local maximum.
V(x) has one local minimum.
V(x) has one local minimum and a second critical point that is also a point of inflection. These points mark the boundary between the first two regions.
A student might begin investigating these three regions first by clicking at a few points in the ab -parameter plane (blue) on the left to see the corresponding functions V(x) and V’(X) graphed on the right (green).
Next he or she might systematically mark the places along each of the horizontal grid lines in the ab -parameter plane where there is one local minimum and a second critical
point that is also a point of inflection. The student can choose different points in the ab parameter plane by clicking on the plane or by using the left-right and up-down arrows.
The smaller arrows move the cursor one pixel at a time. The larger arrows move the cursor 15 pixels at a time. The distance between grid lines is 15 pixels, so the larger arrows move the cursor the same distance as the distance between grid lines.
The figure above shows the student marking the last point in this program. She has just clicked the Mark point button to mark this point along with the other points she found earlier. Notice that these marked points form the expected cusp.
The applet call for this page is shown on the next page. The parameters that you, as a curriculum developer, can change are highlighted. For the most part, they are selfexplanatory.
The applet refers internally to the parameter associated with the horizontal axis of the parameter space by the letter a . In different situations this parameter is more naturally denoted using different notation. Similarly, the parameter associated with the vertical axis of the parameter space is referred to internally using the letter b , but in different situations is denoted by different letters. The two most important parameters are the a_axis_label and b_axis_label parameters. Their values are highlighted in red in the applet call. . These parameters tell the applet the way that you will represent the parameters associated with the two axes of the parameter plane. These same parameters are used as labels for these two axes. You may use any string that begins with a letter and has no special characters or blanks. Notice that the two expressions defining the functions being graphed use this notation as specified by the user. In this example, the parameter associated with horizontal axis is represented by b rather than a because this is the notation used most commonly in this situation. For the same reason the parameter associated with the vertical axis is represented by a rather than b .
You may specify up to 10 curves. The number of curves is specified by the number_of_curves parameter. The expression defining each curve is indicated by a parameter – y_of_x_1 , y_of_x_2 , … y_of_x_10 . The independent variable is always x .
The notation for the parameters associated with the parameter plane is specified, as described above, by the a_axis_label and b_axis_label parameters. The expressions defining each curve use the usual mathematical functions with the usual notation – for example, the sine function is denoted sin .
Note that multiplication is indicated by an asterisk.
The color of each curve is specified in the form “RRRGGGBBB” where each of
RRR, GGG, and BBB is a three digit number between 000 and 255 specifying the red, green, and blue components of the color. Do not omit leading zeros.
Each curve’s thickness or weight is specified by a single digit, 0, 1, or 2 with 0 being the thinnest and 2 being the thickest.
The legend can have up to three lines. They are center-justified. In this example, extra spaces in the second legend line make the lines of the legend appear to be left justified with the legend as a whole center-justified. Notice that you can specify the color of each line in the legend.
To use this applet, include the applet call above in your html page, making the appropriate changes. Include the file Parameter_Plane.jar
in the same directory (or folder) as your html page.
The other parameters for this applet enable you to specify the following:
The background color for the entire applet.
Labels for the x and yaxes.
The range of each of the a, b, x, and y axes and the labels on the graph indicating these ranges. The default ranges and labels are –1…1 for all four axes.
Notice in the example above that the range was omitted for the yaxis.
The following parameters are not shown in the example above. This example shows the defaults.
The background color for the parameter plane: parameter_graph_color
The background color for the function graph: function_graph_color
The color used for the grid lines in both graphs: grid_color
The color used for the marks made when the user clicks Mark point: mark_color
The colors used for the two buttons and their shadows: o mark_button_color o mark_button_shadow_color o clear_button_color o clear_button_shadow_color

