Evaluation_result_and_method_with_simulation_data
advertisement
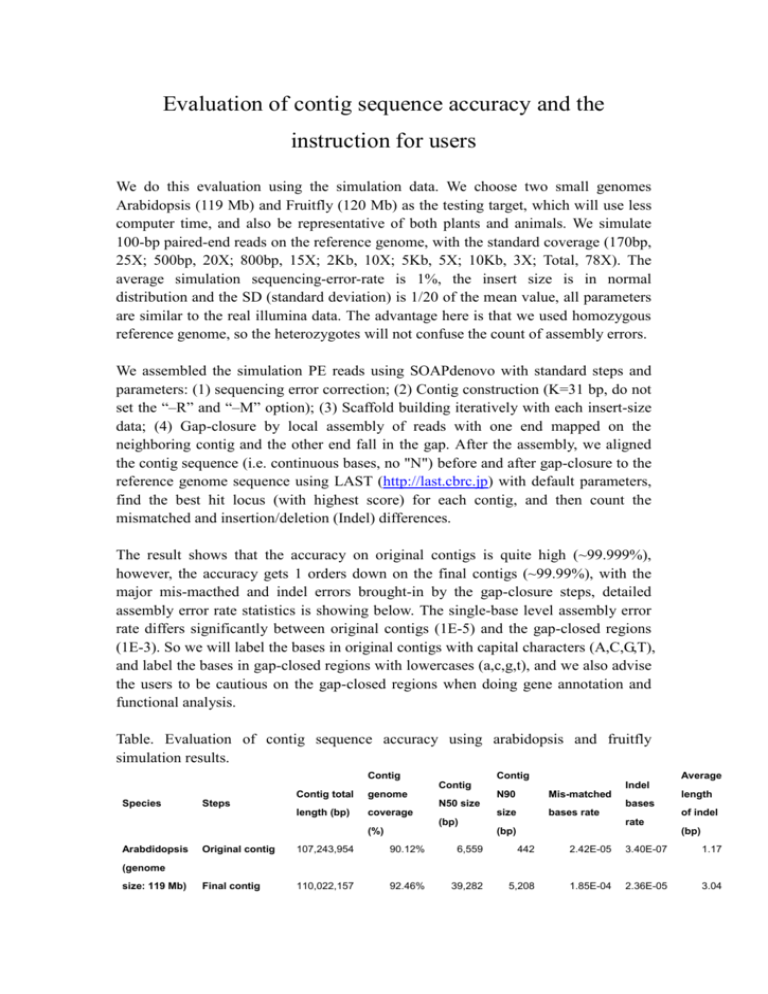
Evaluation of contig sequence accuracy and the instruction for users We do this evaluation using the simulation data. We choose two small genomes Arabidopsis (119 Mb) and Fruitfly (120 Mb) as the testing target, which will use less computer time, and also be representative of both plants and animals. We simulate 100-bp paired-end reads on the reference genome, with the standard coverage (170bp, 25X; 500bp, 20X; 800bp, 15X; 2Kb, 10X; 5Kb, 5X; 10Kb, 3X; Total, 78X). The average simulation sequencing-error-rate is 1%, the insert size is in normal distribution and the SD (standard deviation) is 1/20 of the mean value, all parameters are similar to the real illumina data. The advantage here is that we used homozygous reference genome, so the heterozygotes will not confuse the count of assembly errors. We assembled the simulation PE reads using SOAPdenovo with standard steps and parameters: (1) sequencing error correction; (2) Contig construction (K=31 bp, do not set the “–R” and “–M” option); (3) Scaffold building iteratively with each insert-size data; (4) Gap-closure by local assembly of reads with one end mapped on the neighboring contig and the other end fall in the gap. After the assembly, we aligned the contig sequence (i.e. continuous bases, no "N") before and after gap-closure to the reference genome sequence using LAST (http://last.cbrc.jp) with default parameters, find the best hit locus (with highest score) for each contig, and then count the mismatched and insertion/deletion (Indel) differences. The result shows that the accuracy on original contigs is quite high (~99.999%), however, the accuracy gets 1 orders down on the final contigs (~99.99%), with the major mis-macthed and indel errors brought-in by the gap-closure steps, detailed assembly error rate statistics is showing below. The single-base level assembly error rate differs significantly between original contigs (1E-5) and the gap-closed regions (1E-3). So we will label the bases in original contigs with capital characters (A,C,G,T), and label the bases in gap-closed regions with lowercases (a,c,g,t), and we also advise the users to be cautious on the gap-closed regions when doing gene annotation and functional analysis. Table. Evaluation of contig sequence accuracy using arabidopsis and fruitfly simulation results. Contig Contig Average Contig Contig total Species genome Steps Indel N90 Mis-matched N50 size length (bp) coverage size bases rate (bp) (%) Arabdidopsis length bases of indel rate (bp) (bp) Original contig 107,243,954 90.12% 6,559 442 2.42E-05 3.40E-07 1.17 Final contig 110,022,157 92.46% 39,282 5,208 1.85E-04 2.36E-05 3.04 (genome size: 119 Mb) Fruitfly Original contig 112,687,940 93.68% 27,223 4,953 6.06E-06 6.21E-08 1.40 Final contig 113,889,393 94.68% 116,502 24,927 5.62E-05 1.07E-05 4.39 (genome size: 120 Mb) Notes: (1) Original contig, contigs before gap-closure; (2) Final contig, contig after gap-closure. Contig mean continuous bases (i.e. non “N” character) inside scaffolds.
